
Activate and configure wolkvox BI and make the most of your data for timely and effective decision-making. Interpret the performance and key indicators of your operations and agents to optimize customer service processes and enhance your customers’ experience.
What is wolkvox BI? #
wolkvox BI is a product within the wolkvox suite that allows you to make the most of the data from the operations you manage through our contact center platform. This, in turn, streamlines real-time decision-making. This product facilitates the interpretation of performance and key indicators of your operations and agents, optimizing processes and enhancing the customer experience.
You can access a range of information for up to four (4) months of your operations. Once wolkvox BI is activated, data from your operation will begin to be stored after one (1) hour of activating the product.
After the first hour has passed, the data you will begin to visualize will correspond to the first day within a range of four (4) months of information. With each passing hour since activation, one (1) more day of information will be stored and displayed.
This means that the last 120 days (which correspond to the last 4 months) will be fully available for consultation after 120 hours (5 days) from the activation of wolkvox BI.
Example: You activate wolkvox BI on August 20, 2021, and after one (1) hour of product activation, you begin to visualize information from April 20, 2021. With each passing hour from the moment of activation, you can see one (1) more day in the different dashboards. Around August 25, 2021, you will have a complete four (4) months of information about your operations.
How do I activate wolkvox BI? #
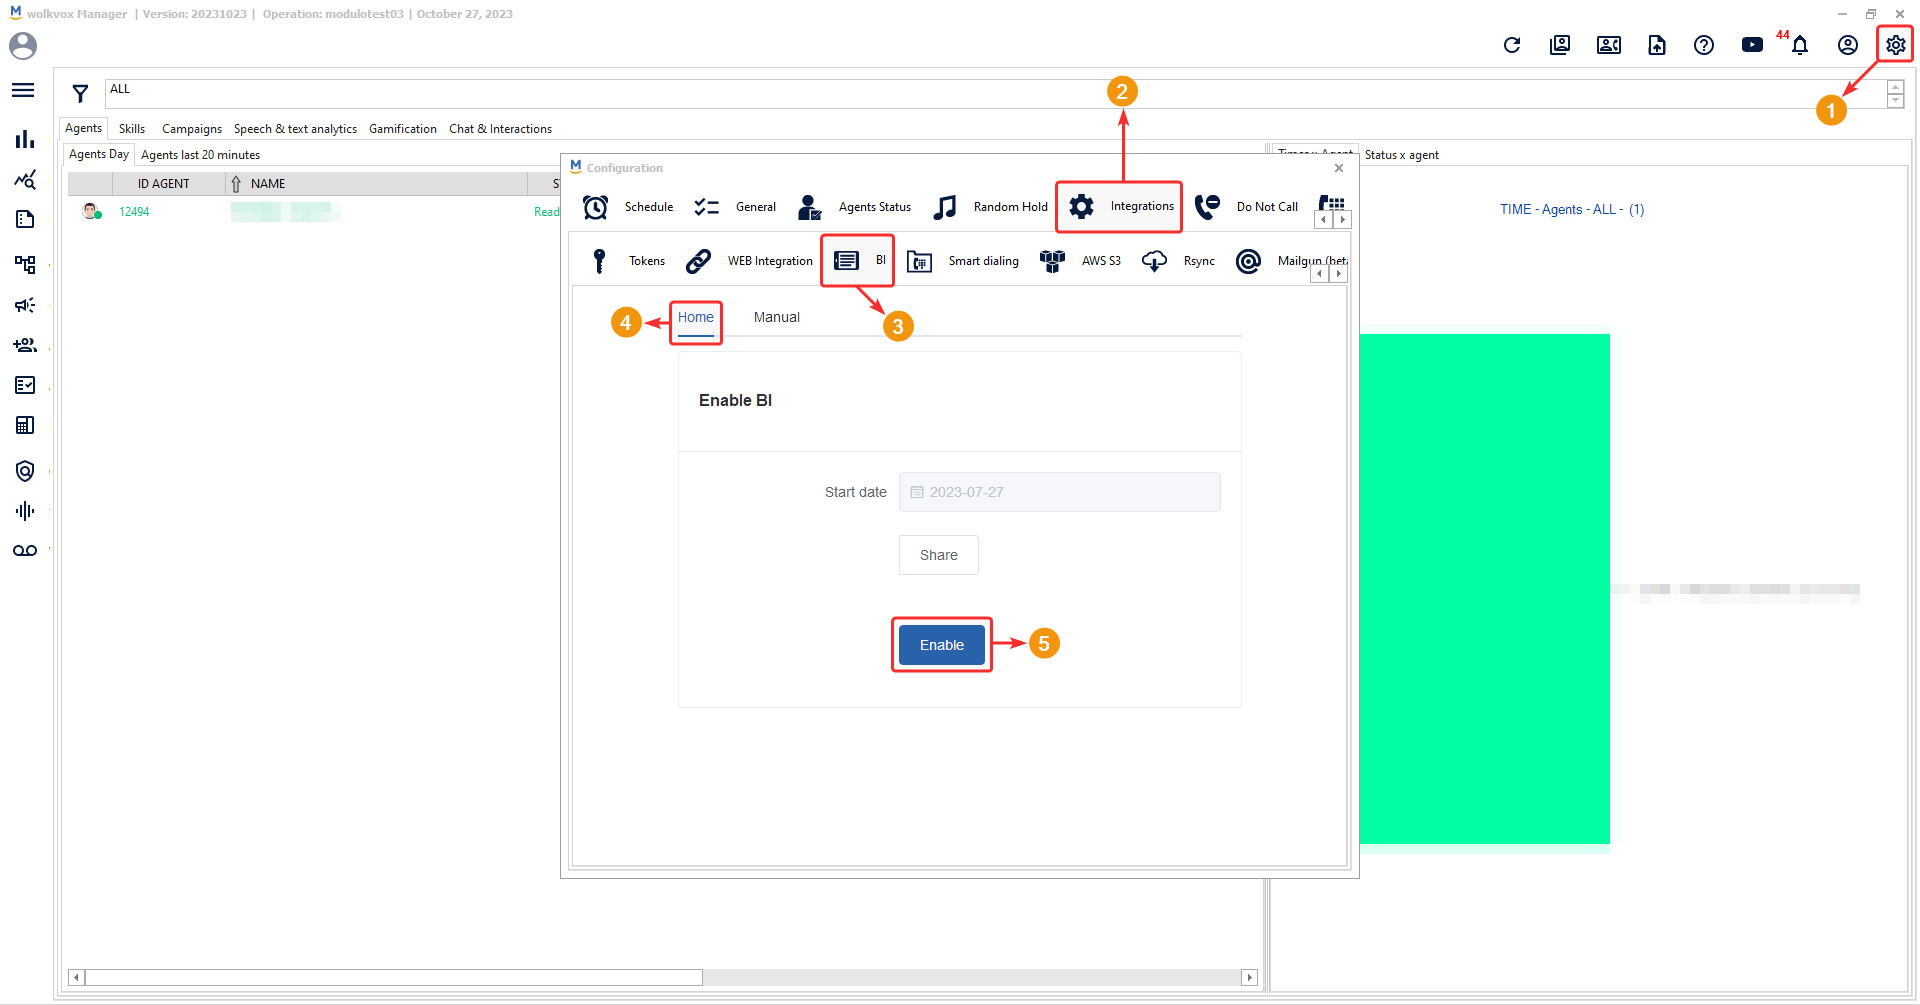
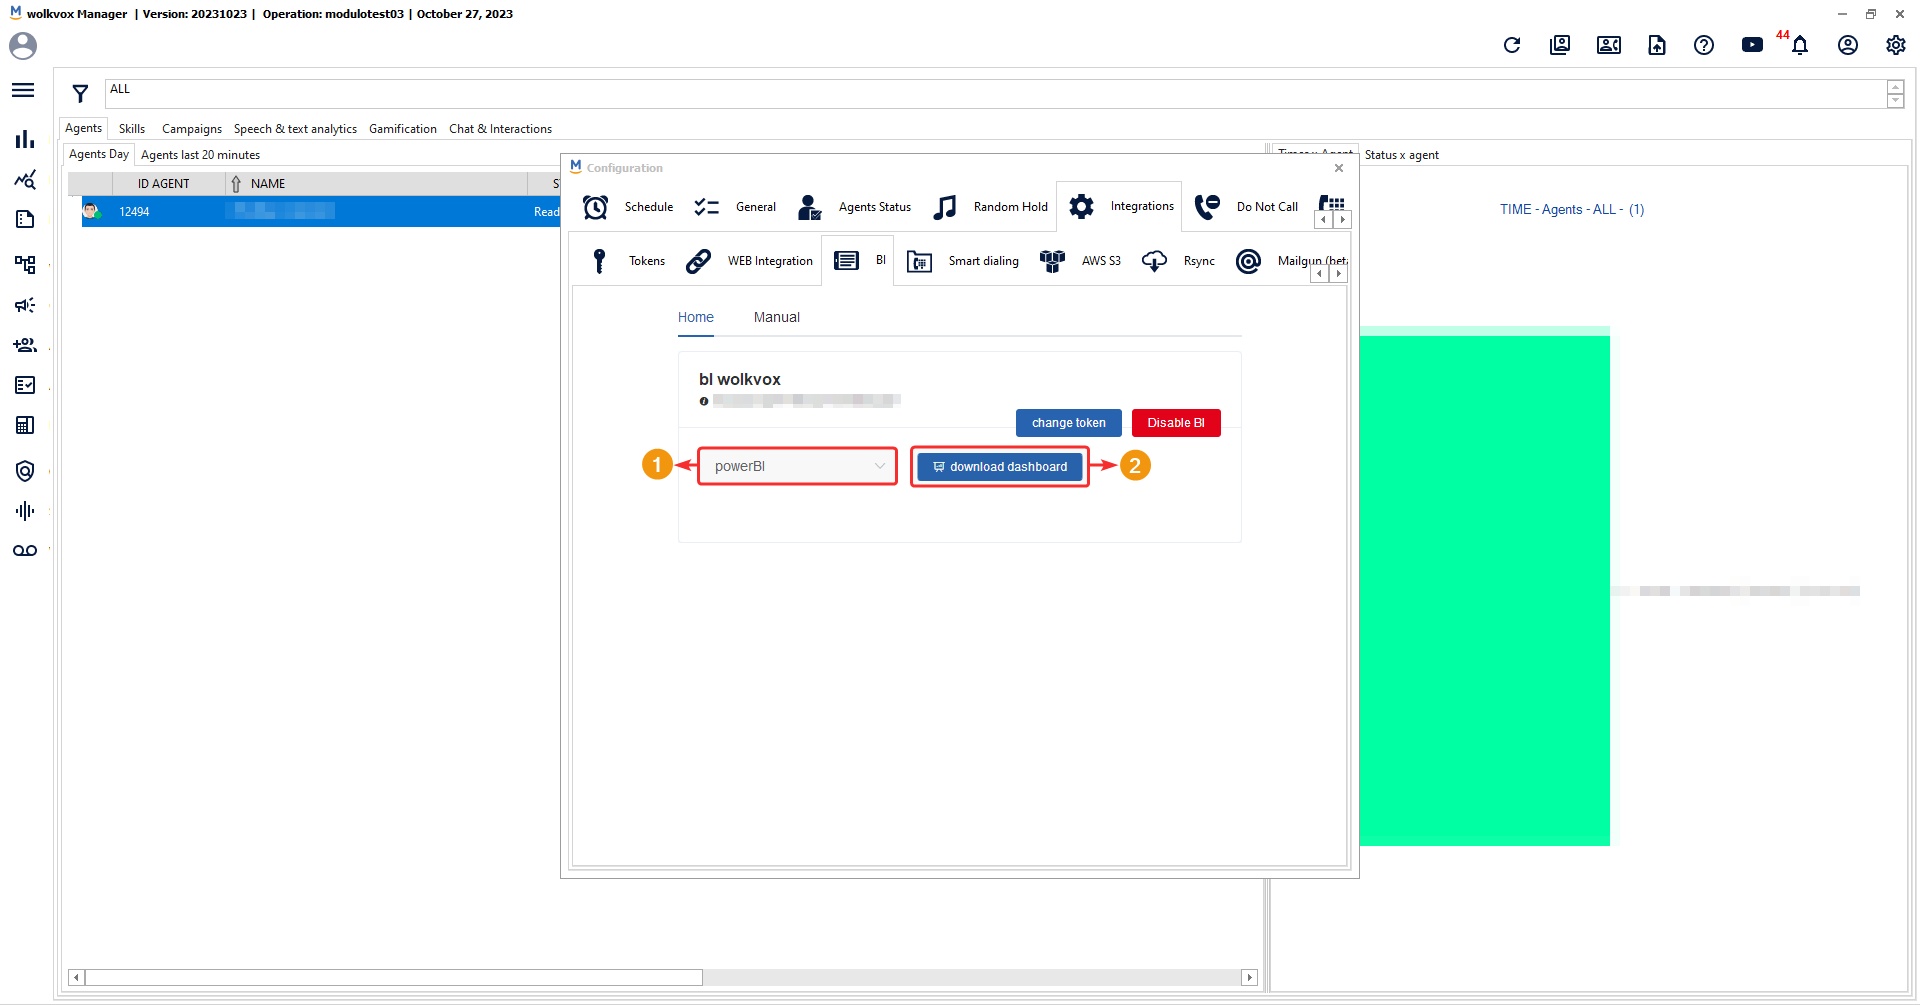
To activate the wolkvox BI product, the operation’s administrator must log in to wolkvox manager and go to settings, which is located in the secondary menu. Settings > Integrations > BI. Then, in the ‘Home’ section, click on the ‘Enable’ button.
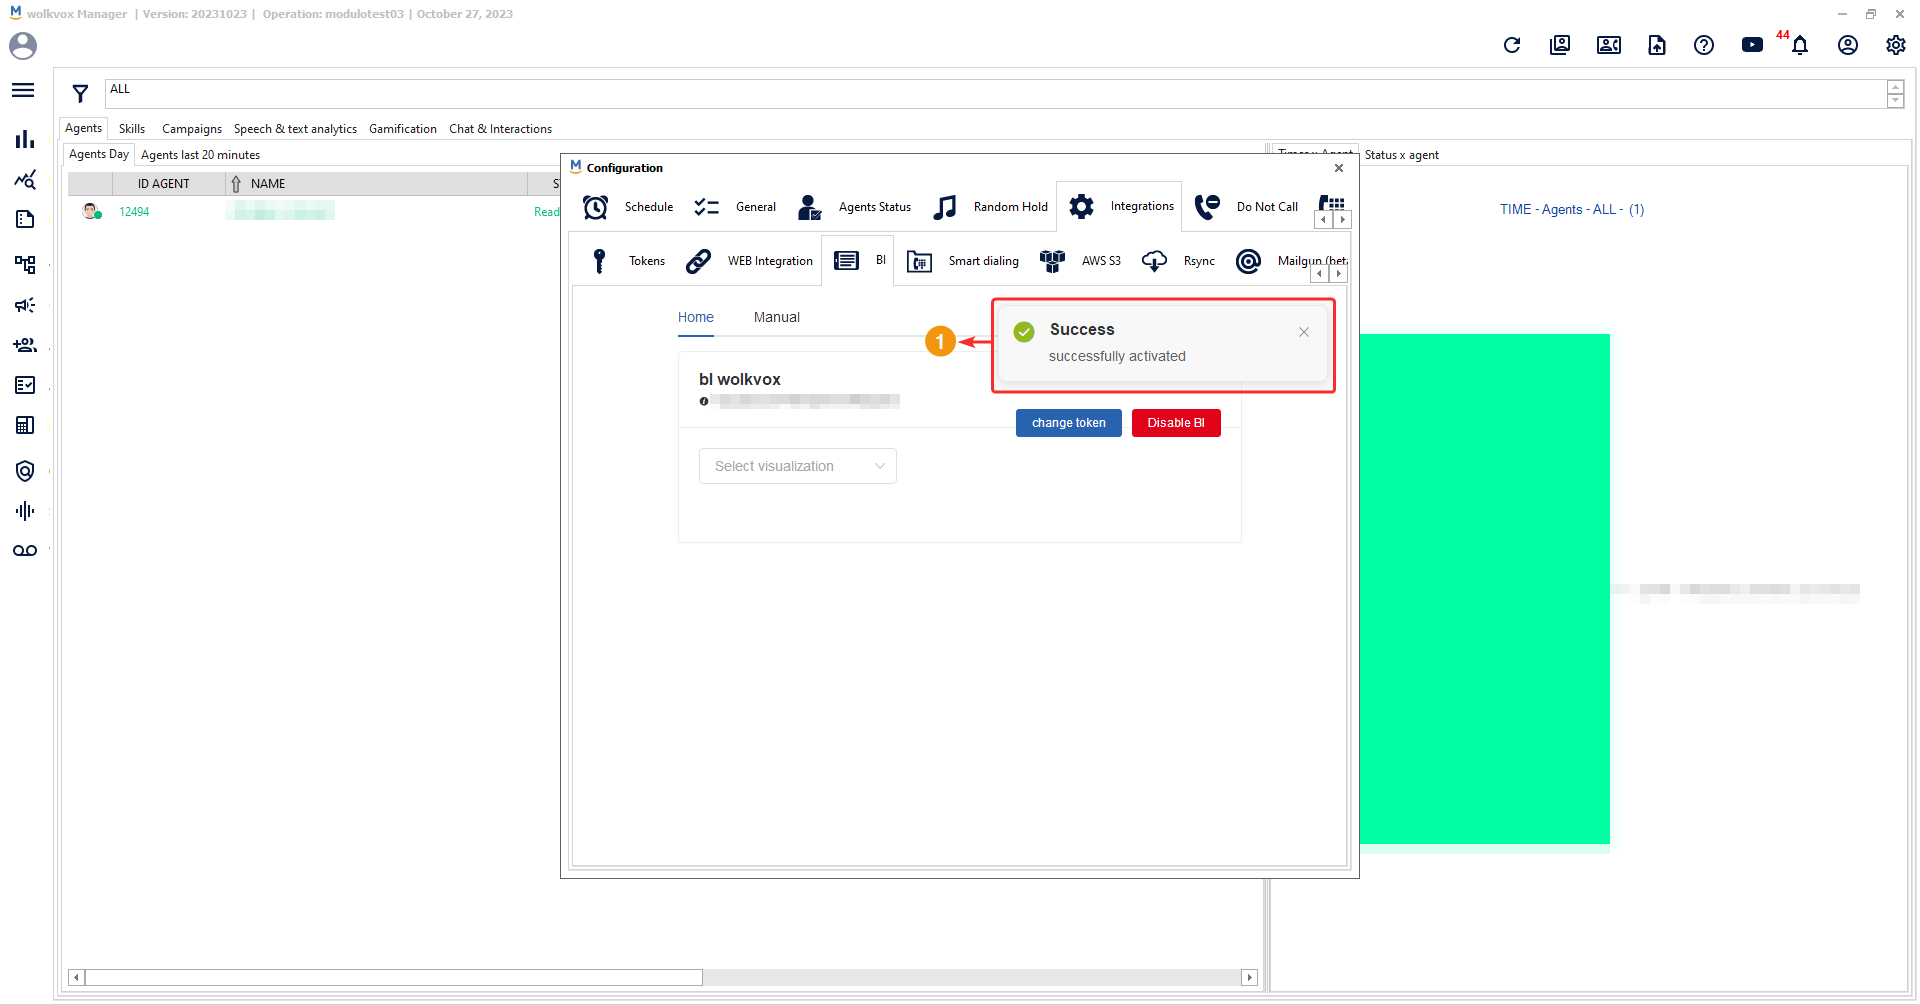
You will receive a message confirming that the activation was successful. Additionally, you will receive a token that will allow you to connect your operation’s databases to the visualization layer of your choice.
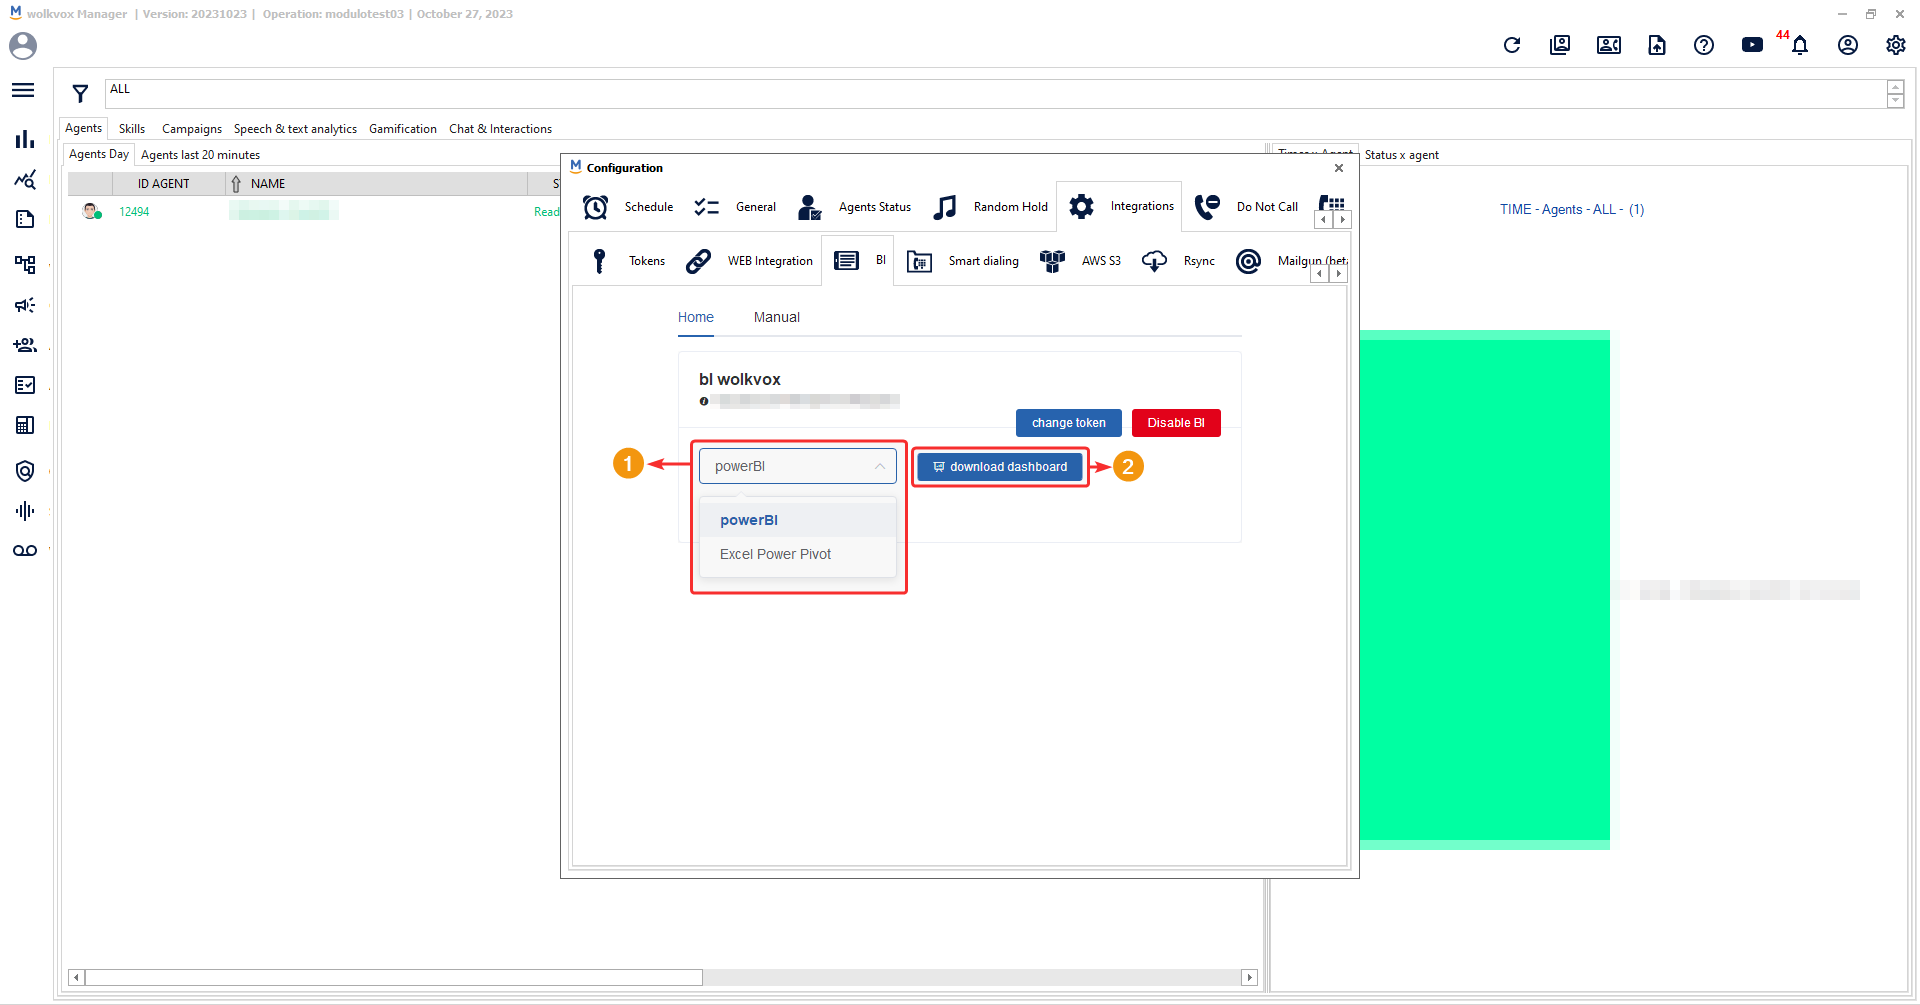
Important: Initially, wolkvox BI is enabled for use in Power BI and Power Pivot in Microsoft Excel.
When selecting the application for visualization, finish by clicking “Download dashboard.”
How do I configure wolkvox BI? #
Below, you will learn how to configure wolkvox BI according to the visualization layer of your choice.
Important: Initially, wolkvox BI is enabled for use in Power BI and Power Pivot in Microsoft Excel.
Setting up wolkvox BI for Power BI #
What is Power BI?
Power BI is a cloud-based business analytics solution that allows you to combine different data sources, analyze them, and present an analysis through reports and dashboards. With Power BI, you have easy access to data inside and outside the organization on almost any device. These analyses can be shared by different users within the same organization and can have access to real-time business information.
It is primarily composed of these components:
- Power BI Desktop: Free desktop application for transforming, visualizing data, and creating reports.
- Power BI Service: Online service (SaaS) with functionality similar to the desktop application. It allows you to publish reports and set up data updates automatically so that the organization’s staff has up-to-date information.
- Power BI Mobile: Mobile application available for Windows, iOS, and Android for viewing reports that automatically update with changes in the data.
If you have chosen to view the performance of your operation in Power BI, you must have Power BI Desktop installed on your PC. You can find out how to download Power BI Desktop by clicking here.
Creating a Free Account in Power BI #
Through Microsoft’s Power BI, we have the possibility to publish a project on the web for free and share it via a URL so that multiple users can view the information with constant updates.
To do this, you must create a free Power BI account. As a requirement, you must have an official Microsoft email account (corporate or educational).
Go to the URL and follow the steps provided by Power BI to create your account:
https://powerbi.microsoft.com/en-us/
Download Power BI for Desktop #
To download Power BI in the desktop version:
- Go to the URL https://powerbi.microsoft.com/en-us/desktop/
- Identify the section “Microsoft Power BI Desktop”.
- Click on “Download”.
- This application is downloaded through the Windows “Microsoft Store” app. When you click “Download,” a pop-up window will appear asking you to allow the app to open in the Microsoft Store.
Configuración para PowerBI #
Una vez descargado Power BI desktop en su PC, el administrador de la operación debe ingresar a wolkvox manager y dirigirse a configuración que se encuentra en el menú secundario. Setting(configuración)/integrations(integraciones)/BI.
Seleccione “powerBI” y de clic en “Download dashboard”.
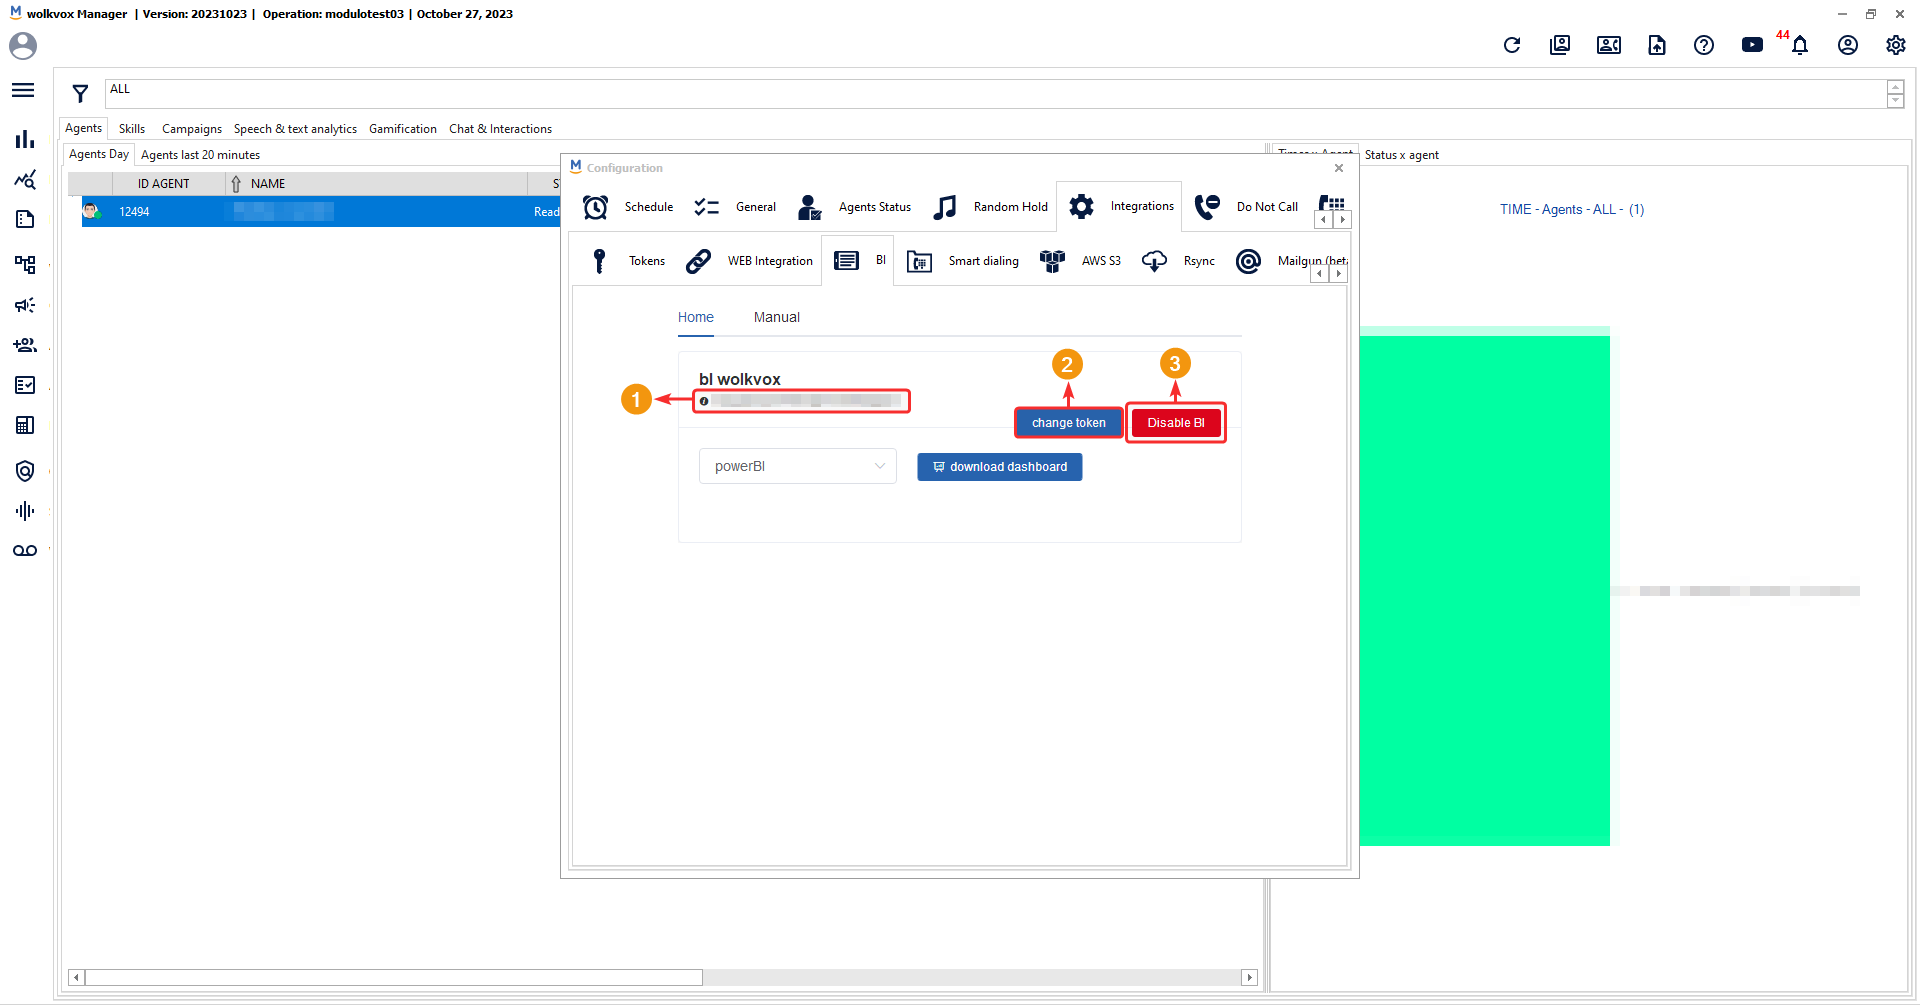
- Please note the token for future integration.
- You can click on “Change token” to modify the token if needed.
- You have the option to use the “Disable BI” button to deactivate the wolkvox BI integration tool.
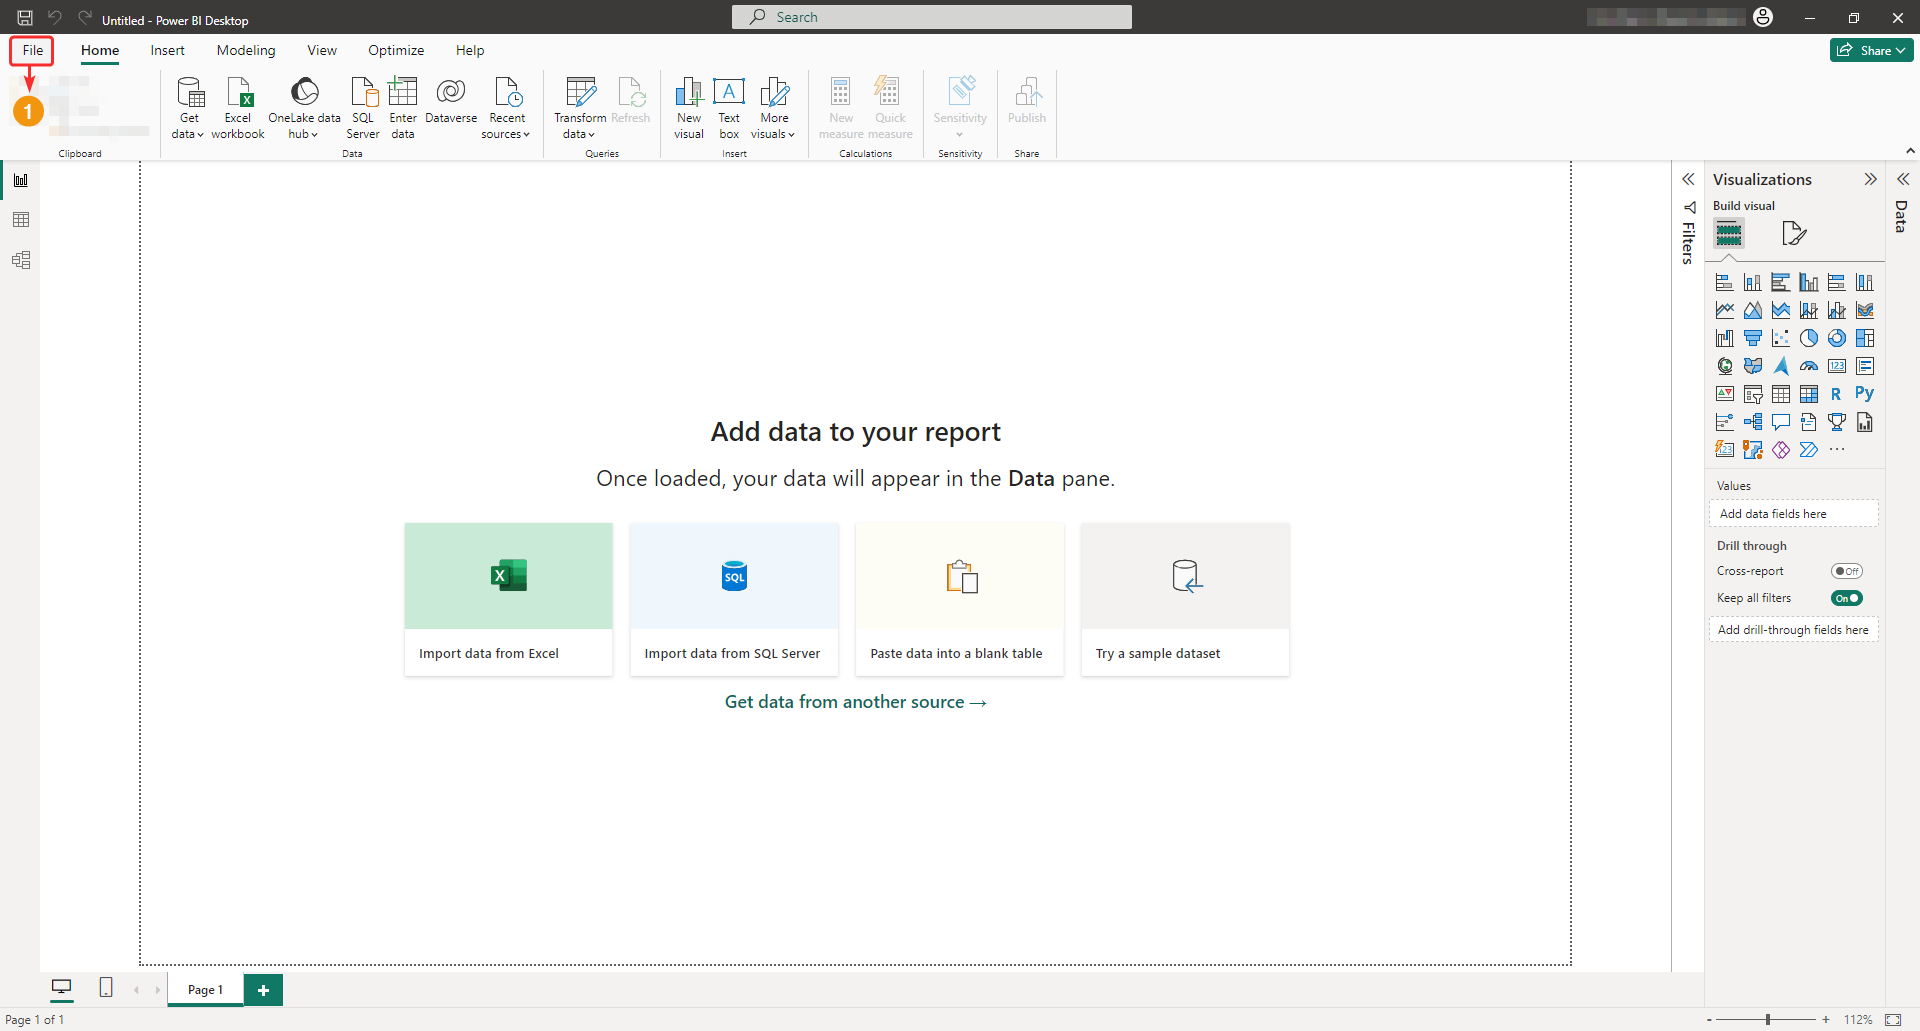
The file will be downloaded to the local folder on your PC: C:\Manager\downloads and will be named “PB_templateTelefonia.pbix”.
Next, open this file in Power BI Desktop by going to the “File” tab.
Click on Open > Browse this device.
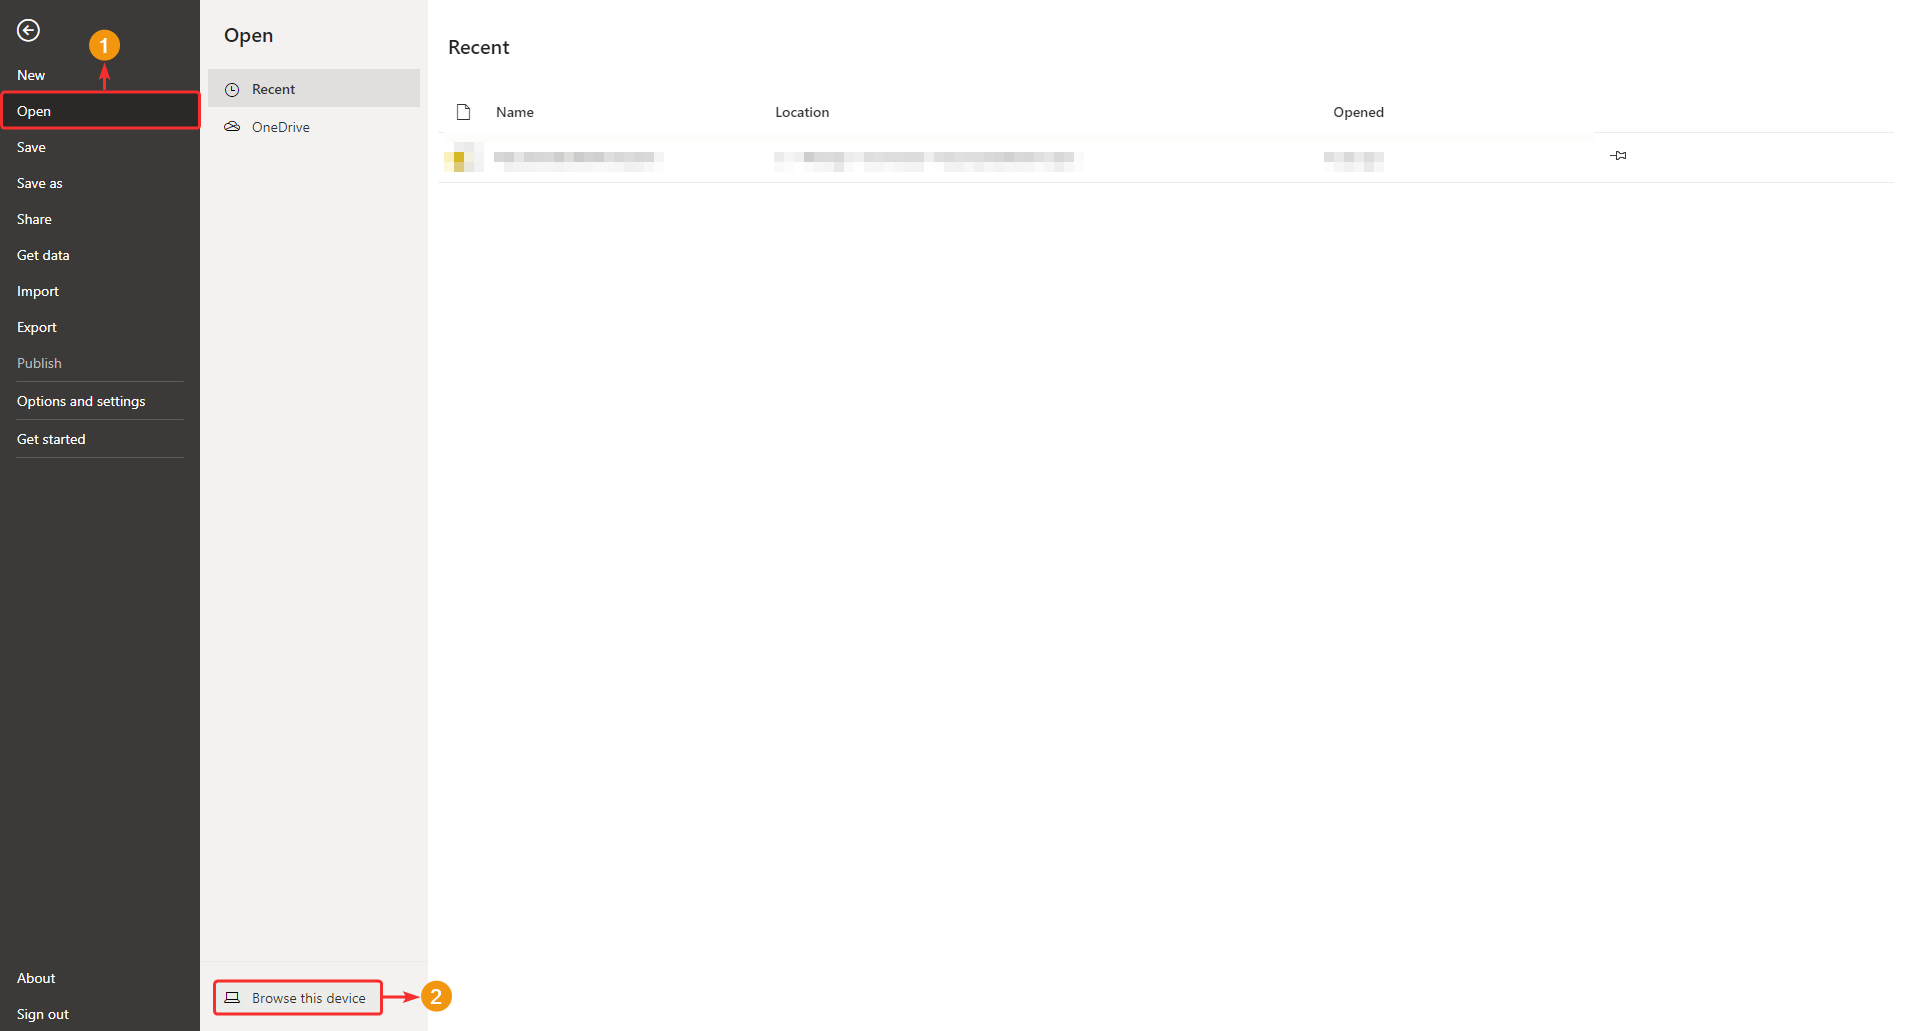
- Search for the file using the file explorer that opens up.

Anonymous Access Pre-Configuration #
It is recommended to perform the following configuration to avoid data visualization issues.
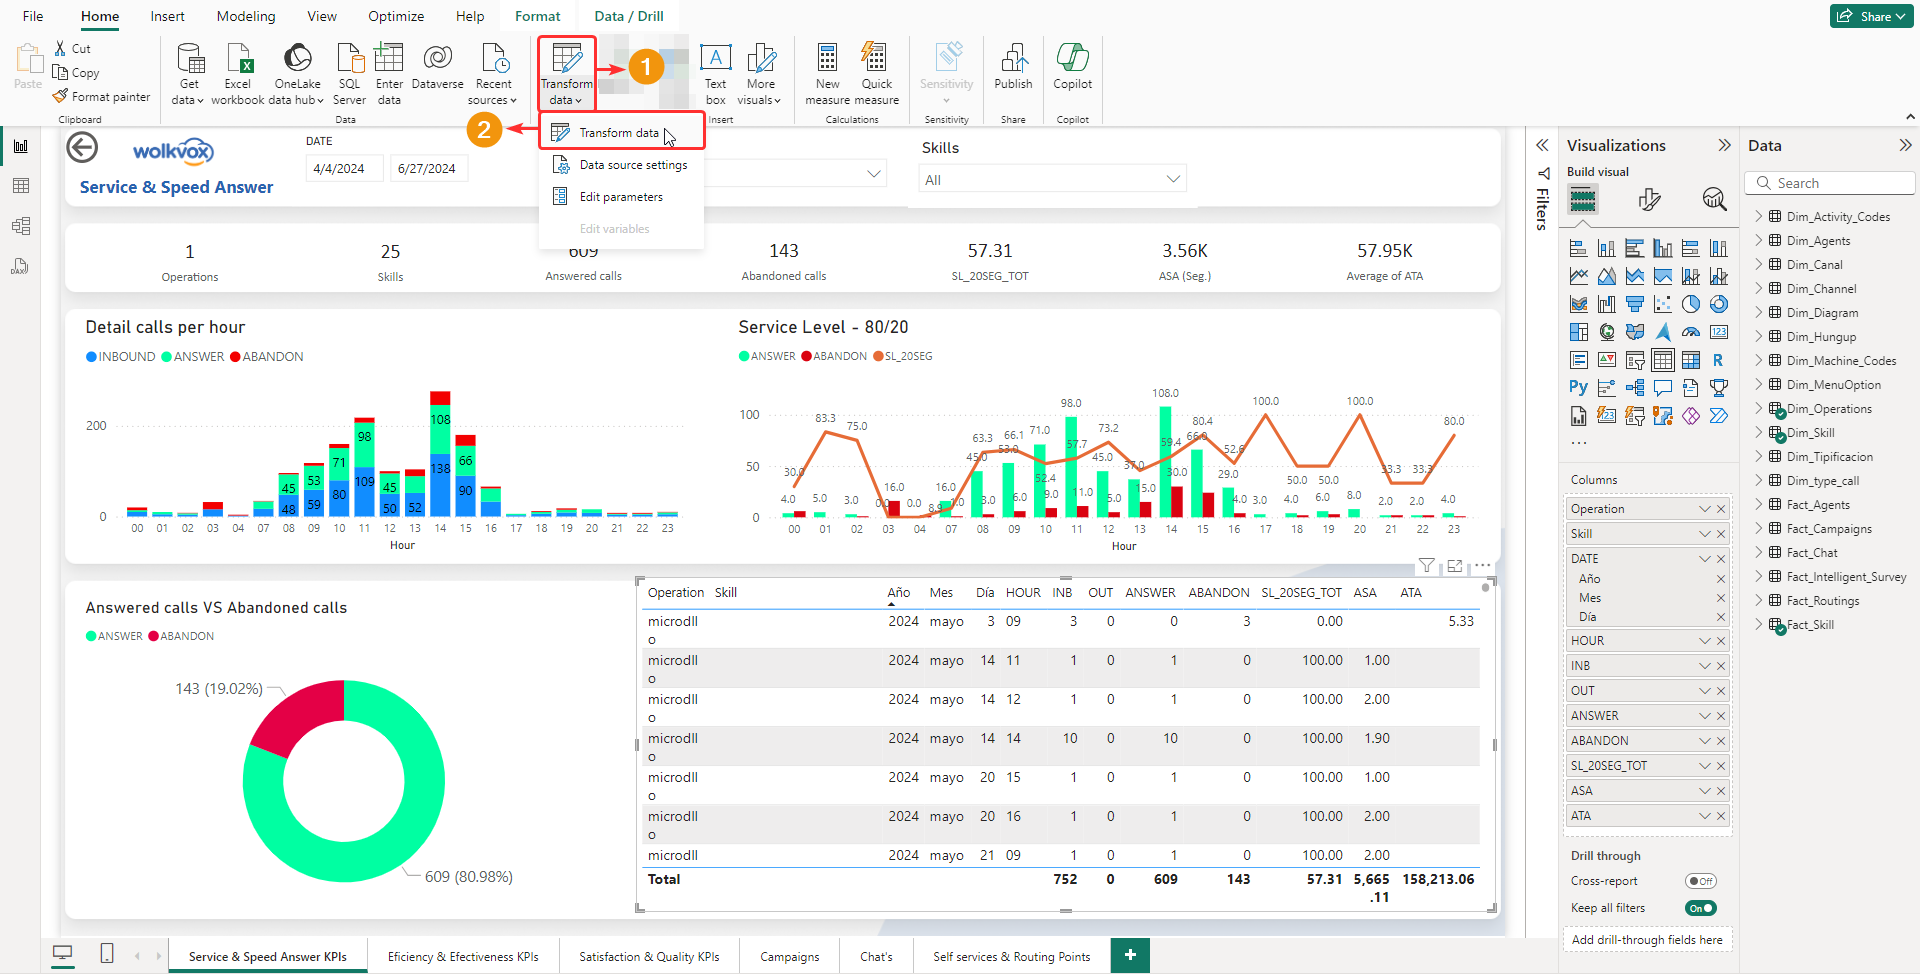
- Click on the “Transform Data” dropdown menu.
- Select the “Transform Data” option.
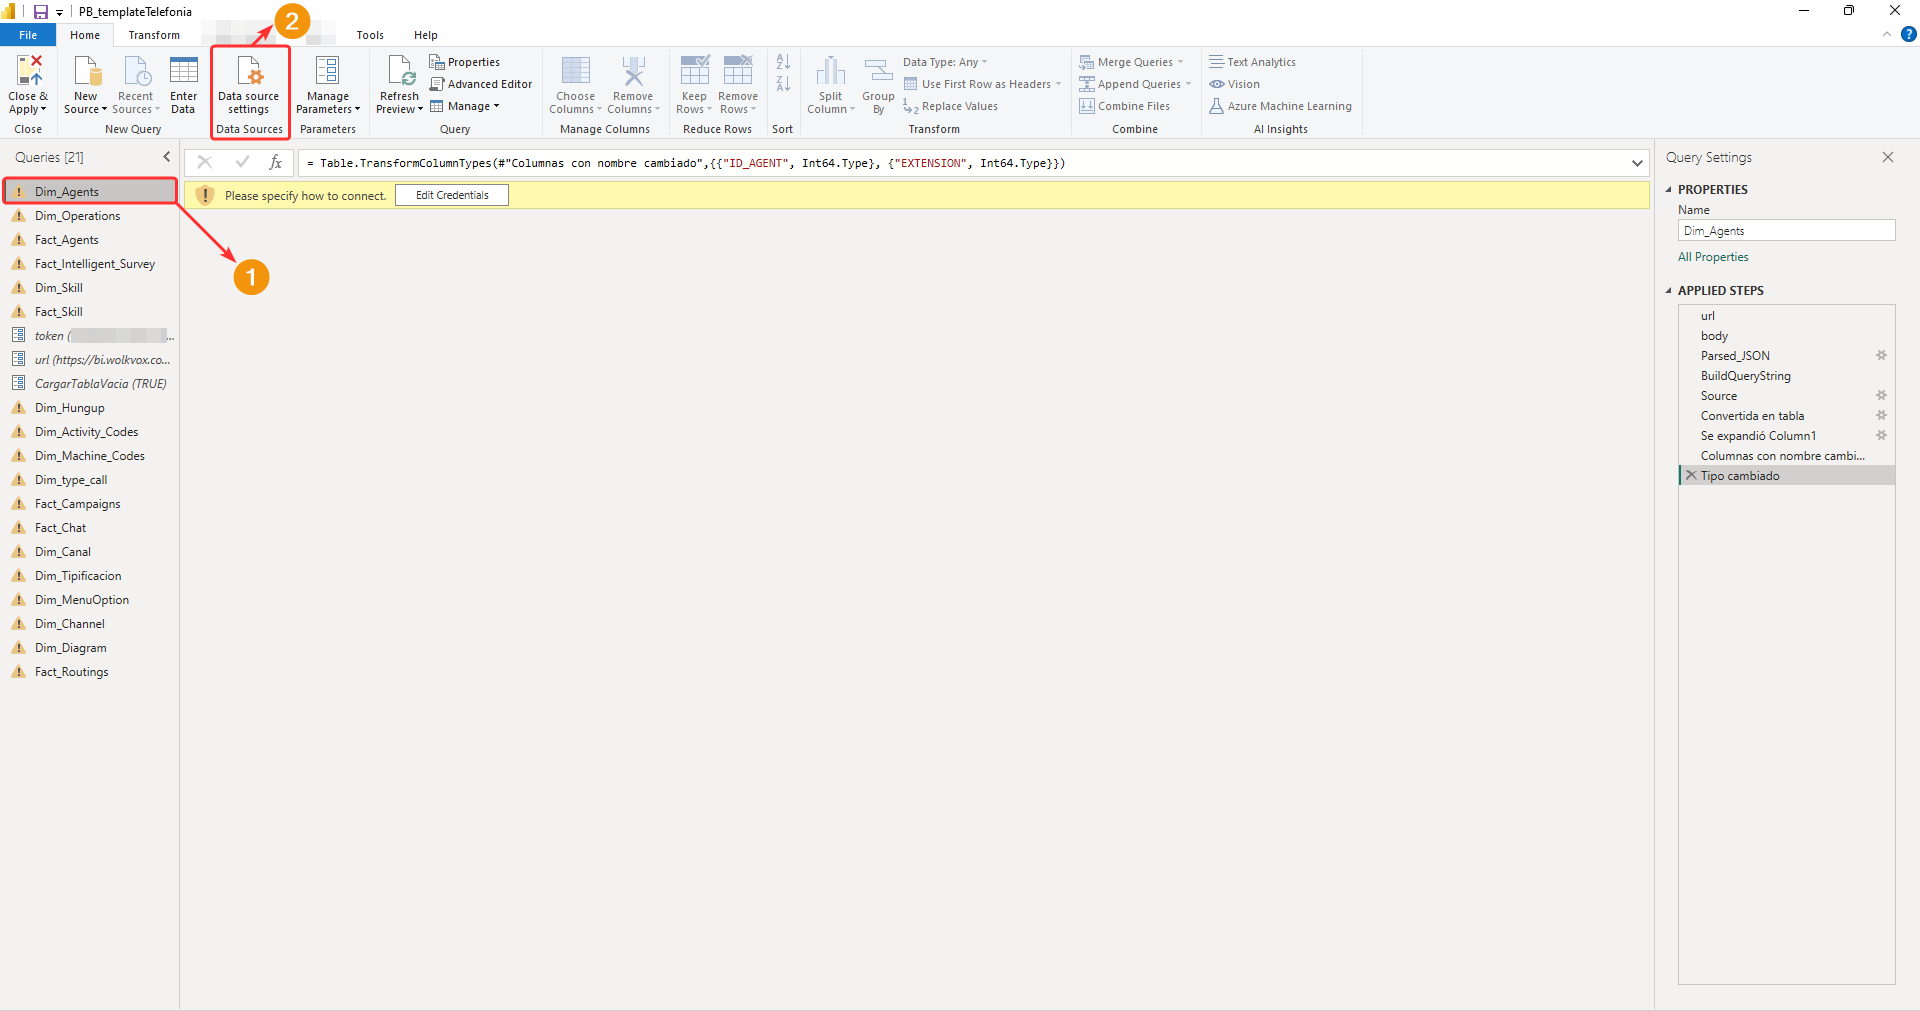
Select one of the Dims from the left panel in the new window that has opened.
Left-click on the “Data Source Configuration” button.
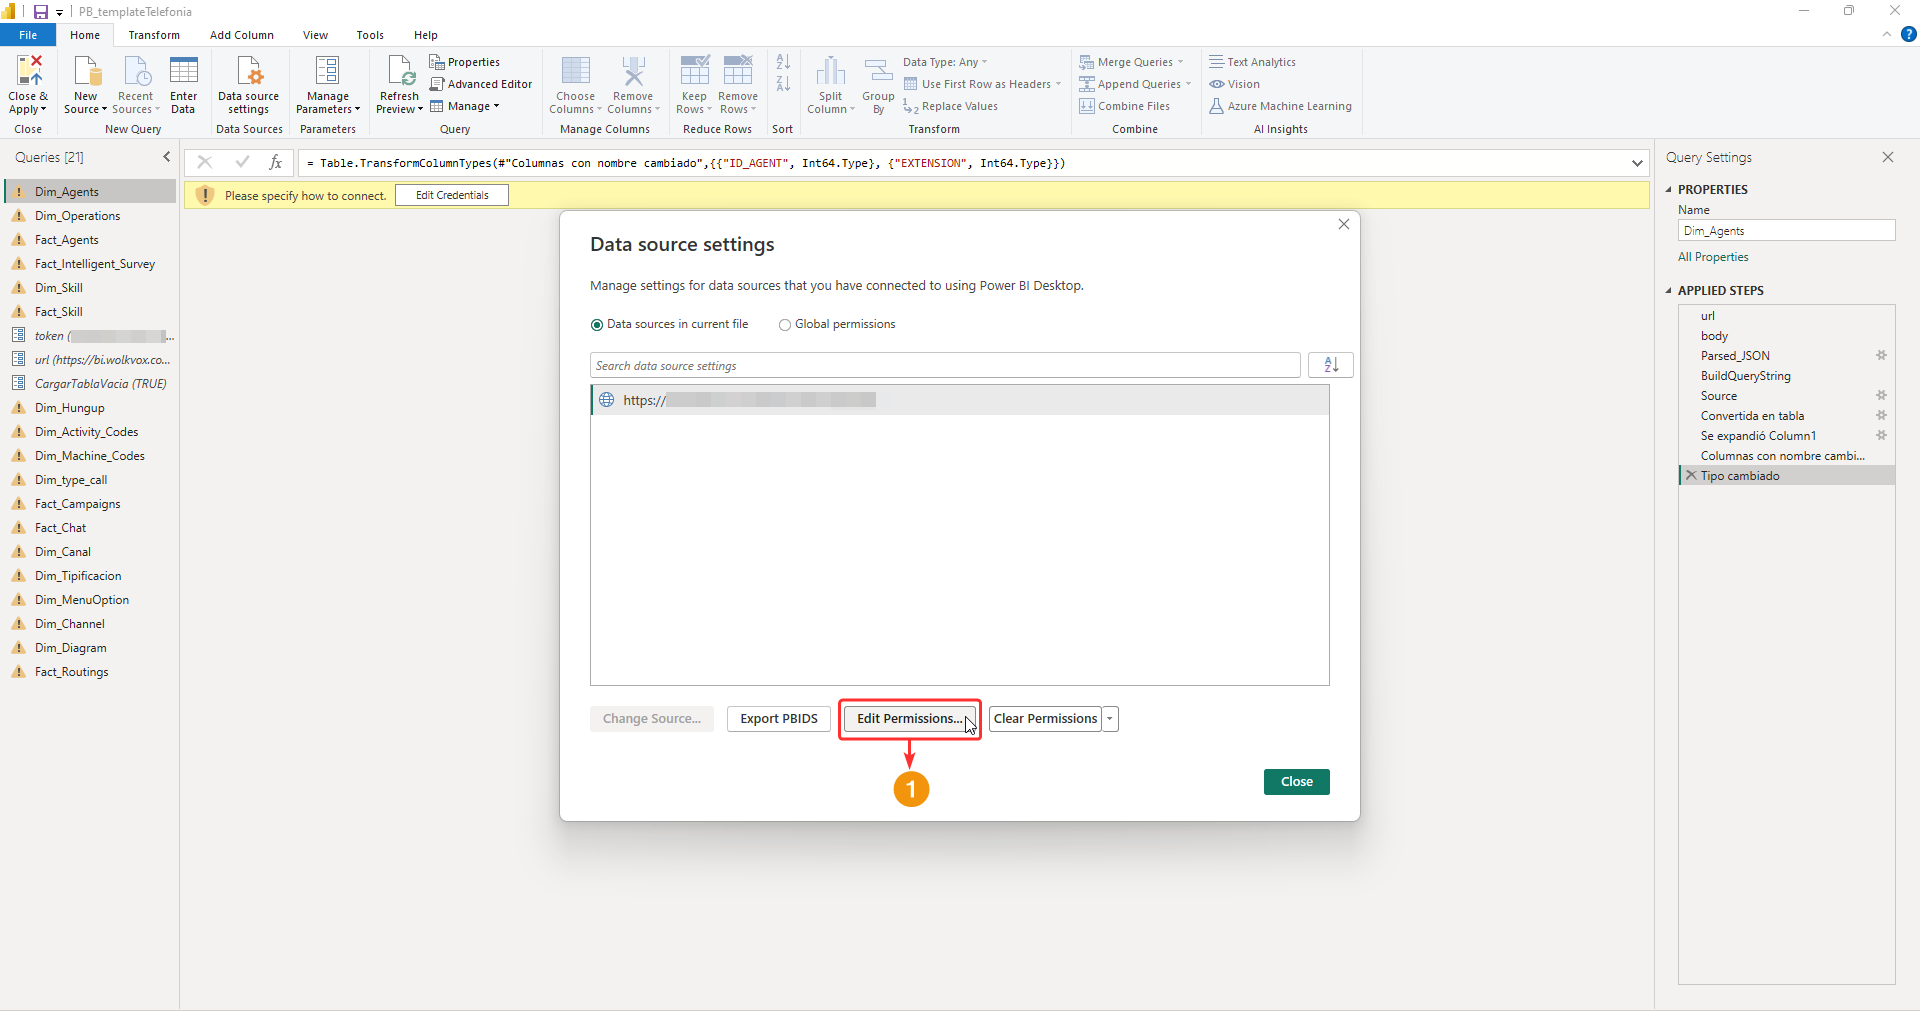
A new window will open where you need to click on “Edit permissions”.
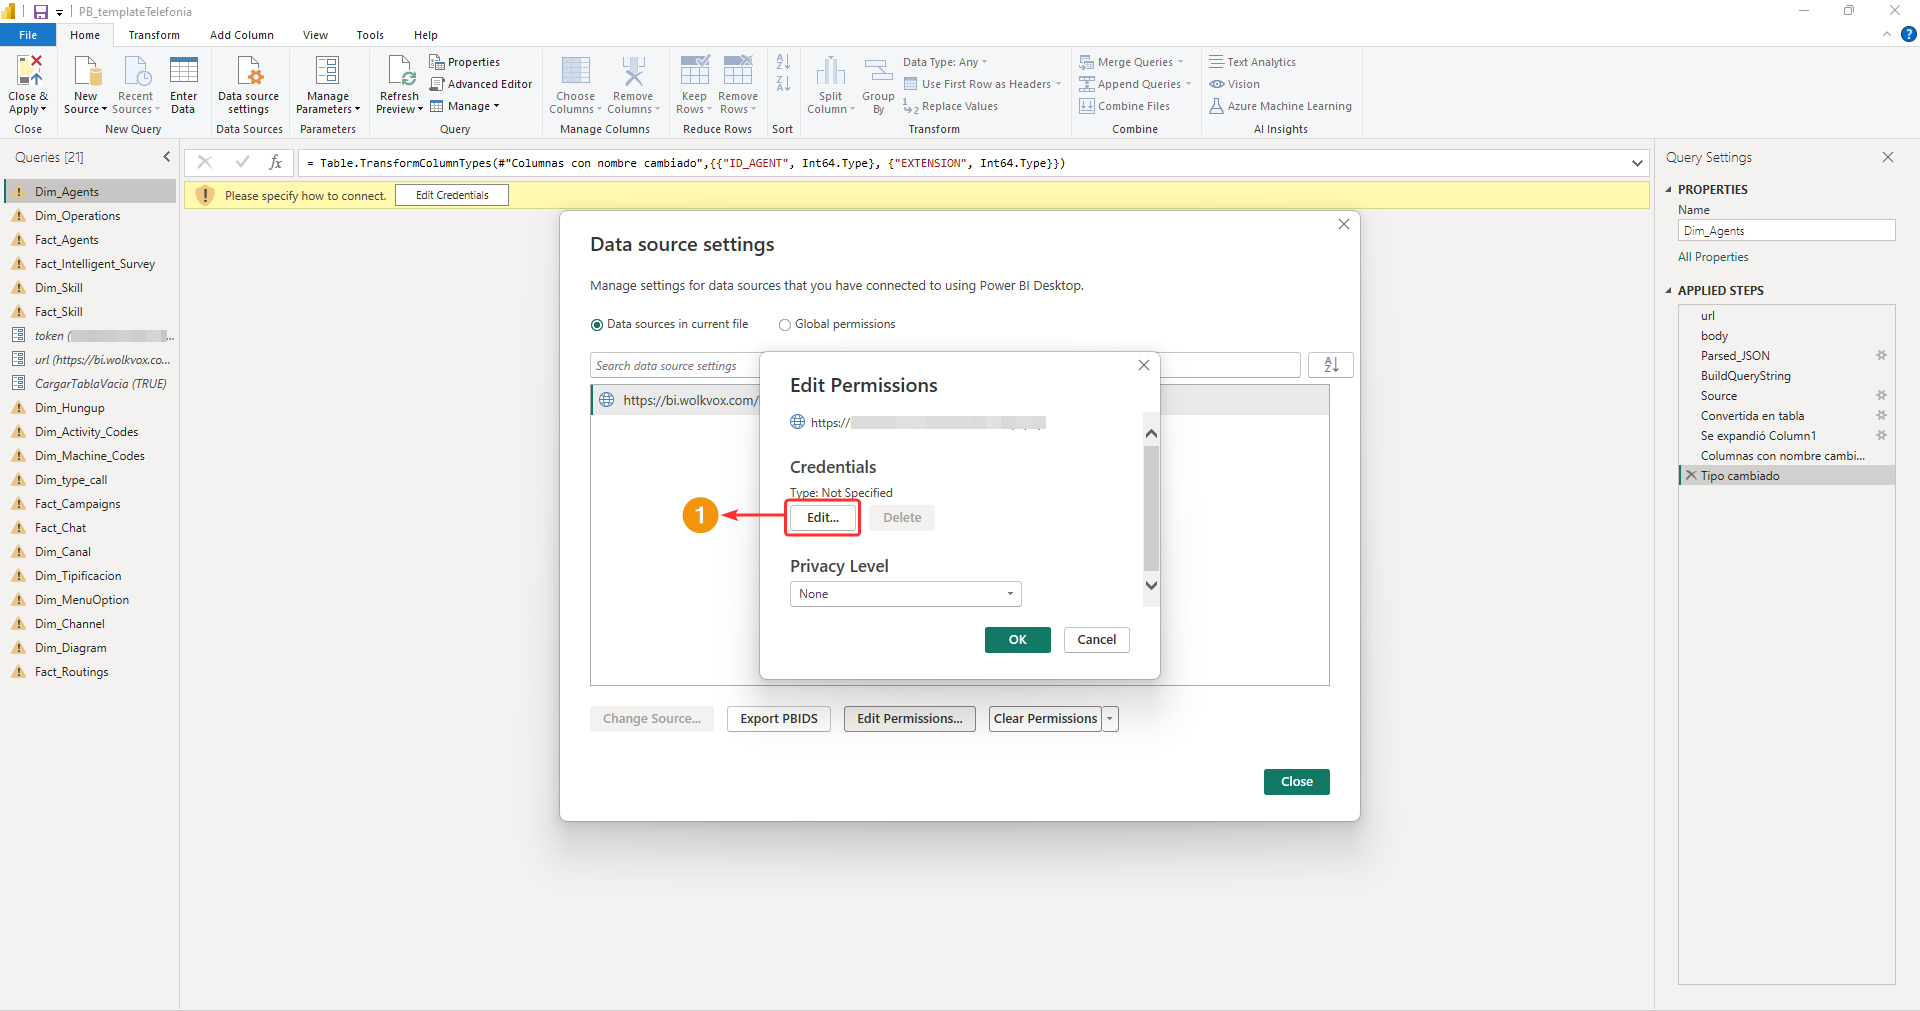
The permissions editing window will open, click on “Edit”.
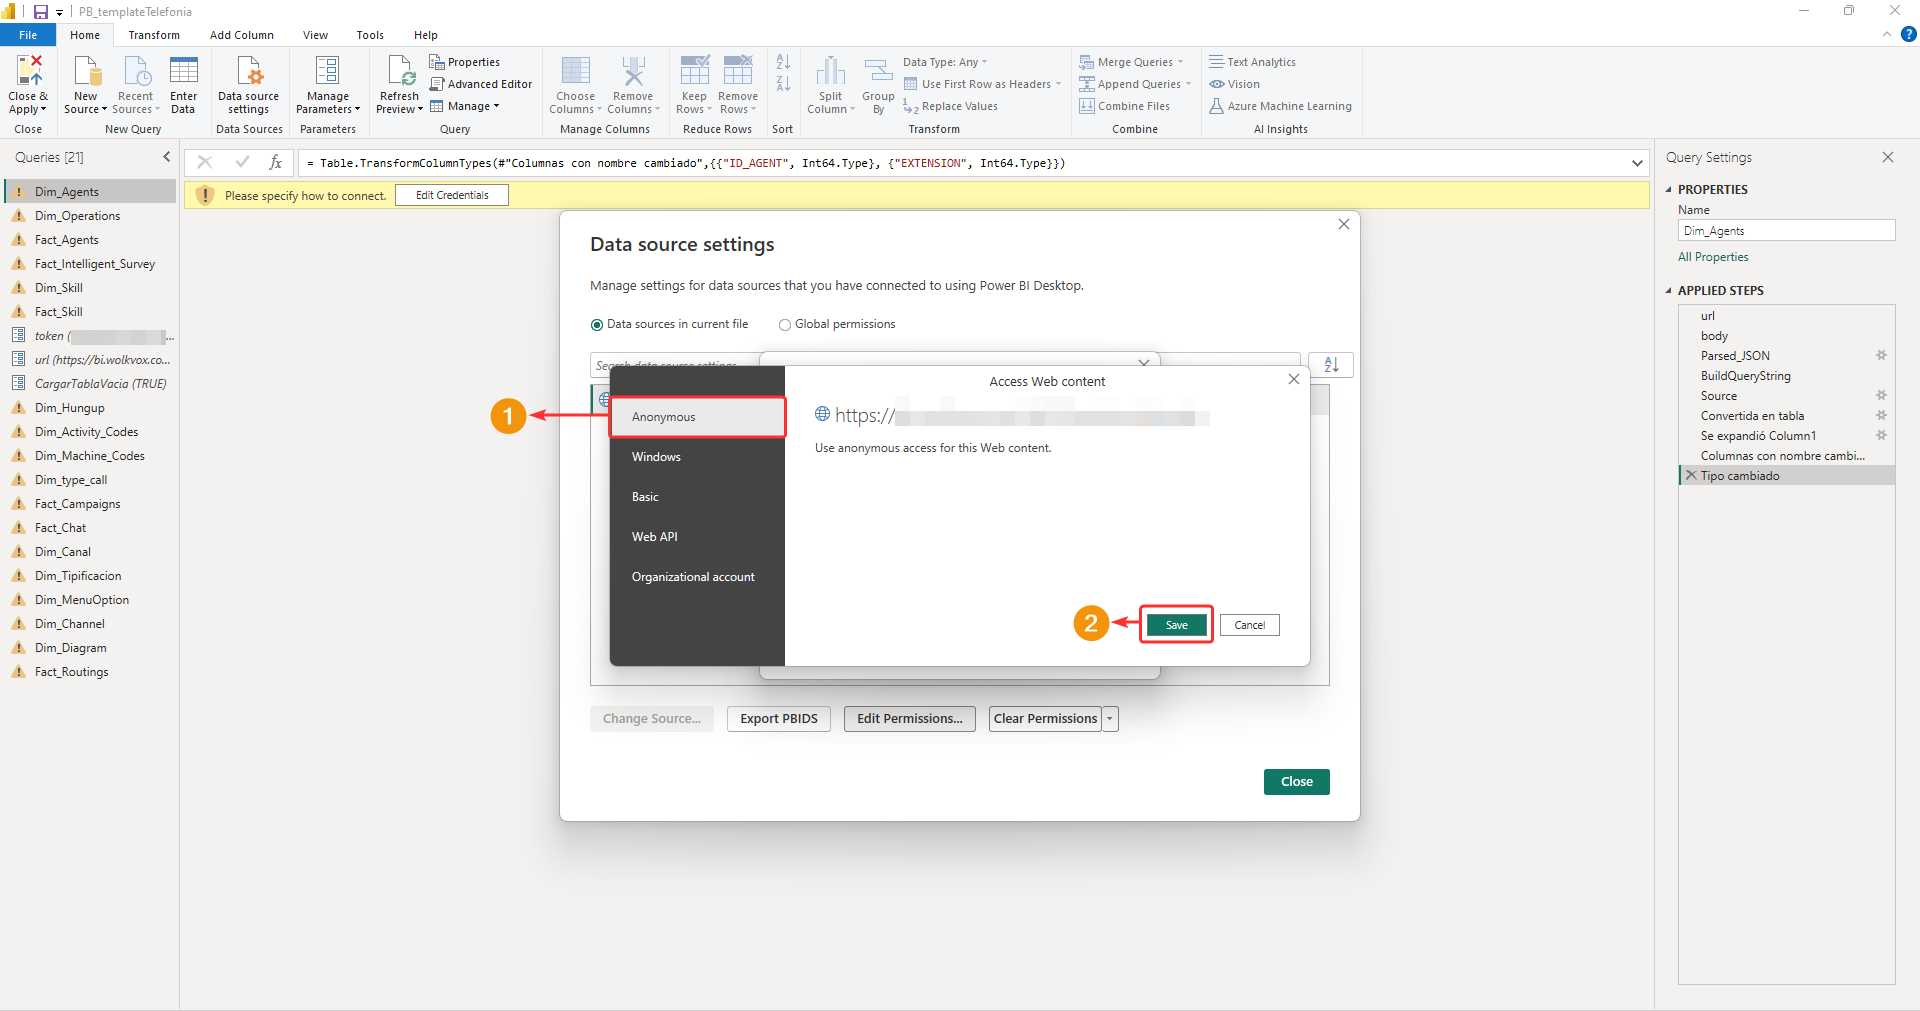
- Select the “Anonymous” tab.
- Click “Save”.
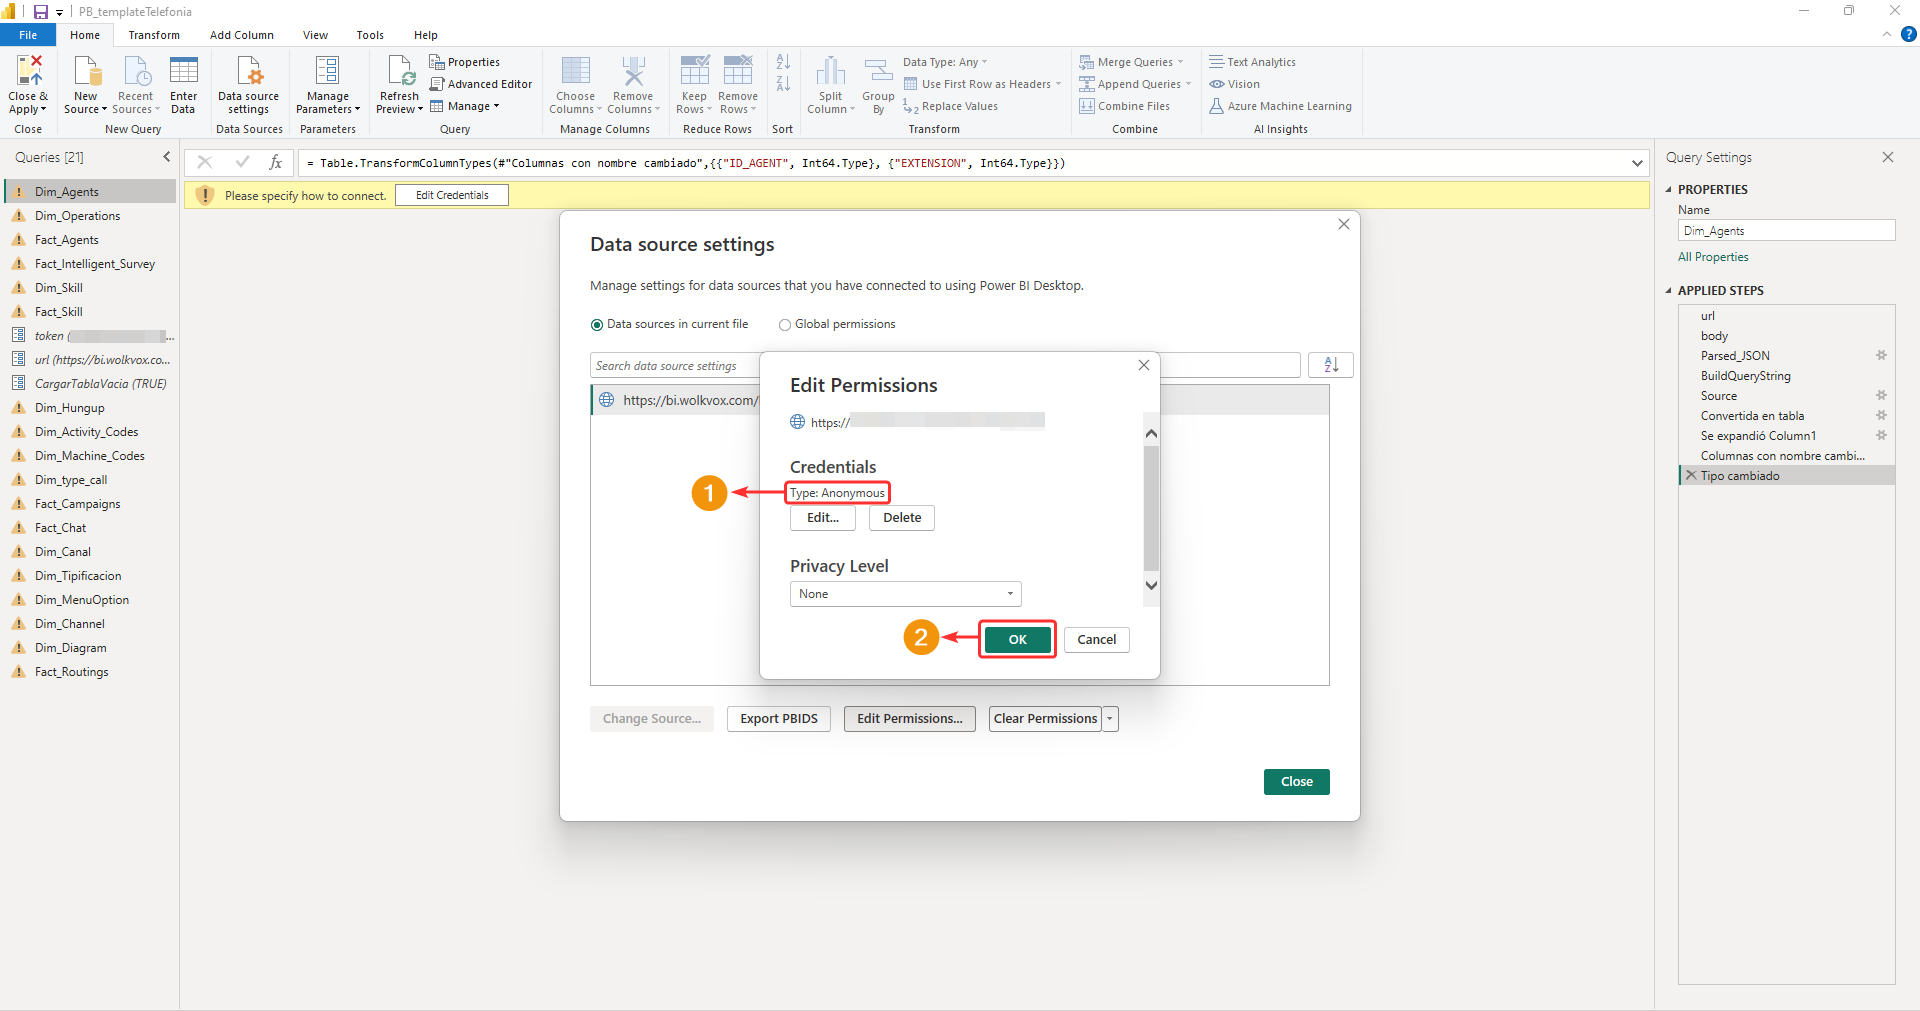
- The credential has now changed to anonymous.
- Click “Accept”.
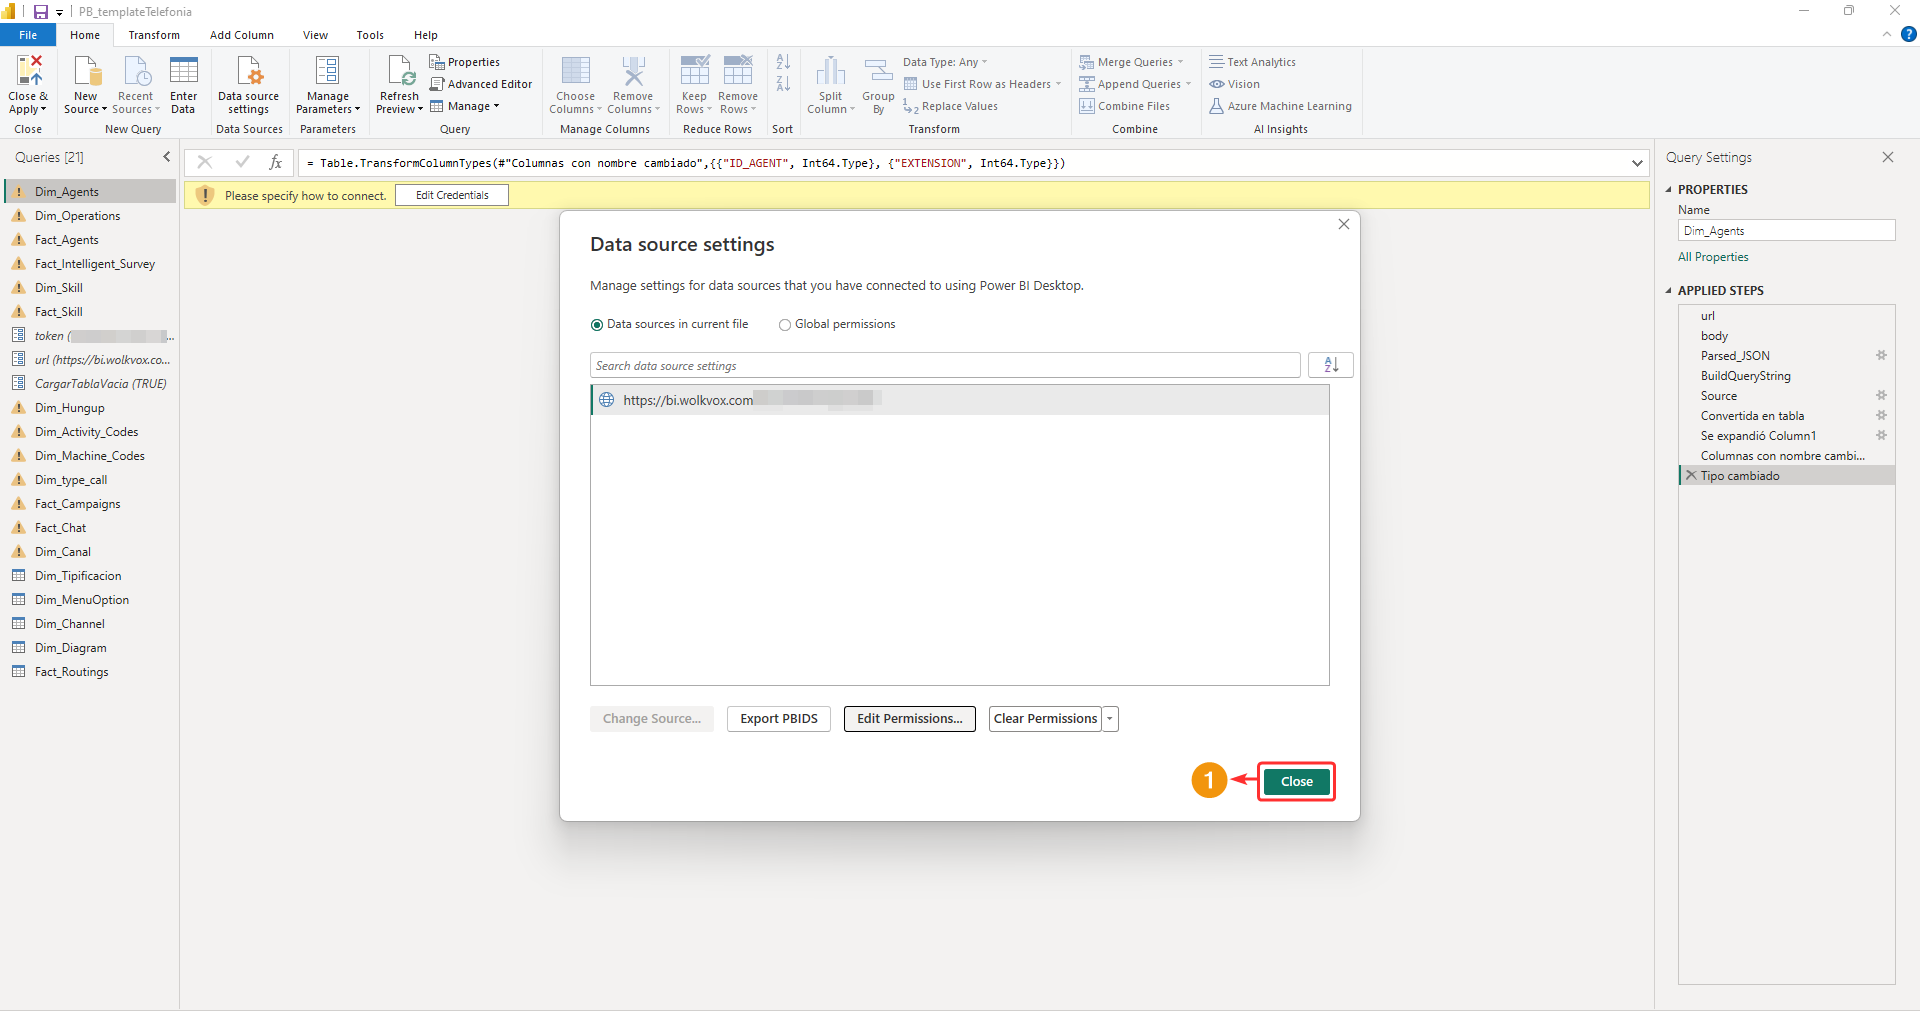
Close the window.
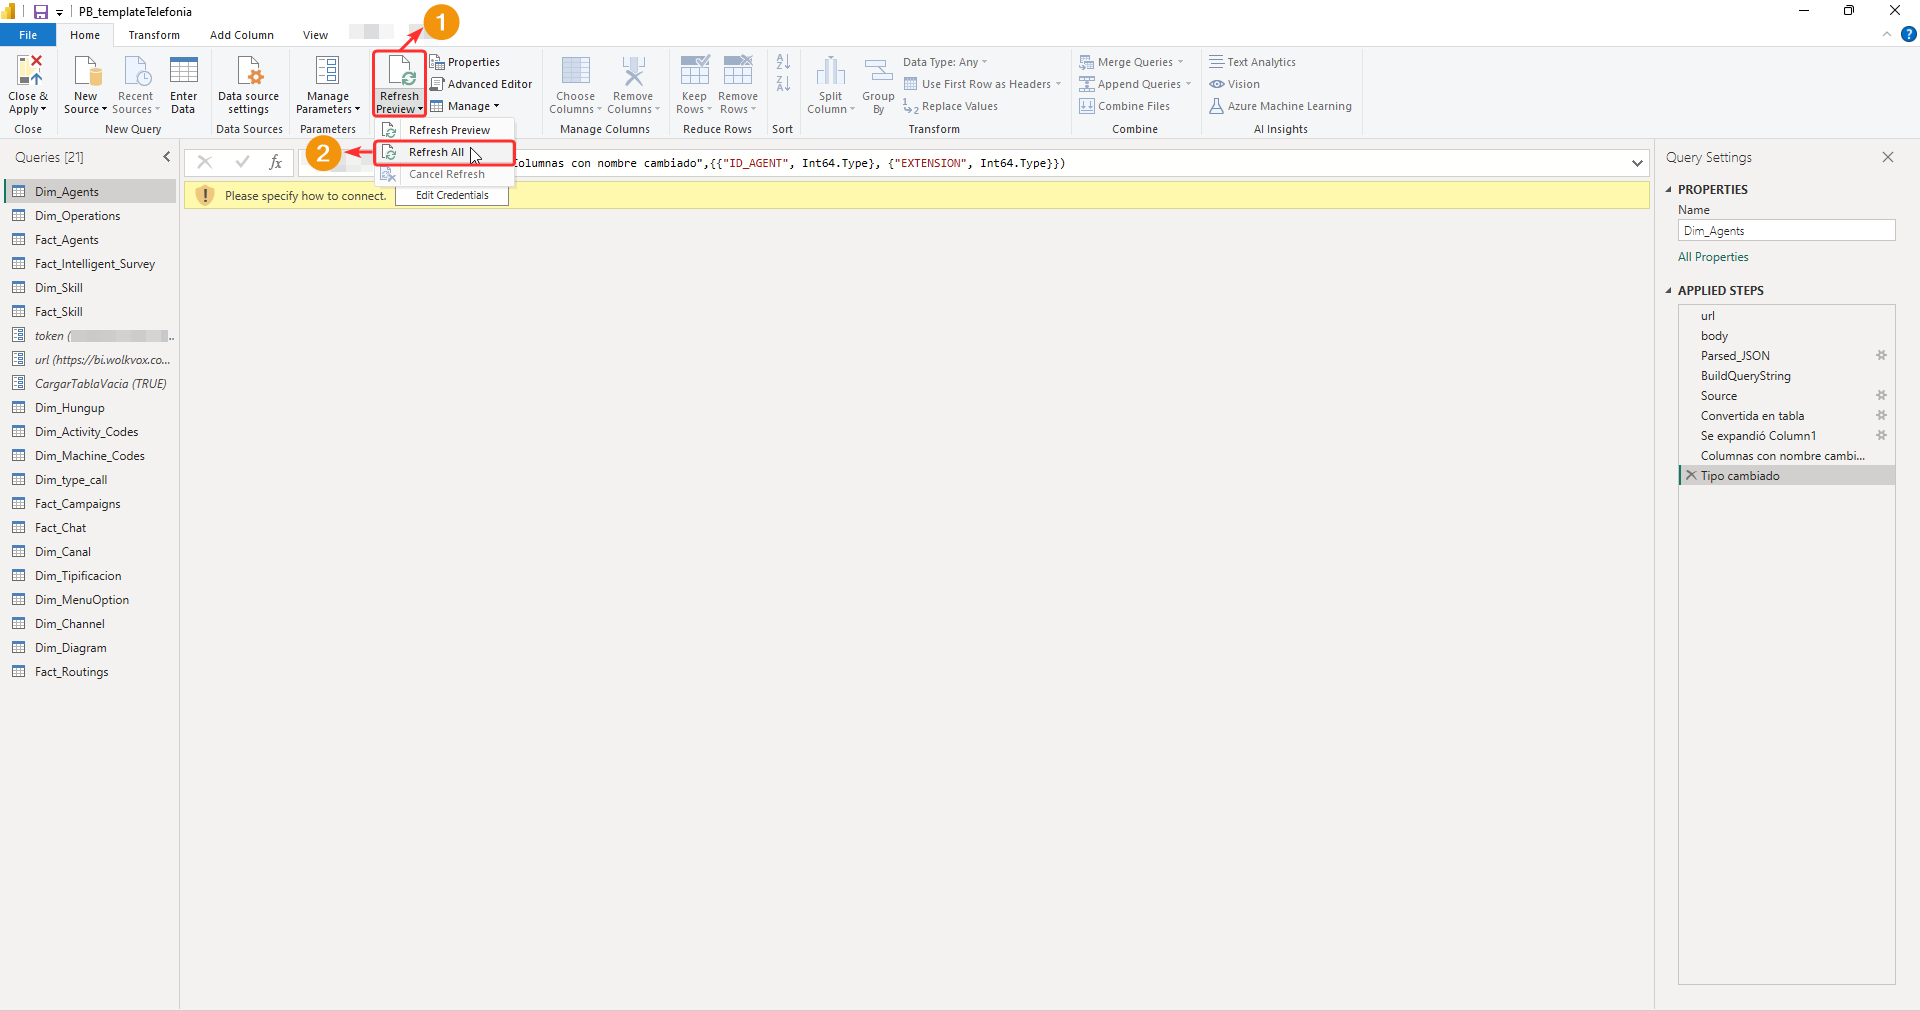
- Left-click on the “Refresh Preview” dropdown menu.
- Select the “Refresh All” option.
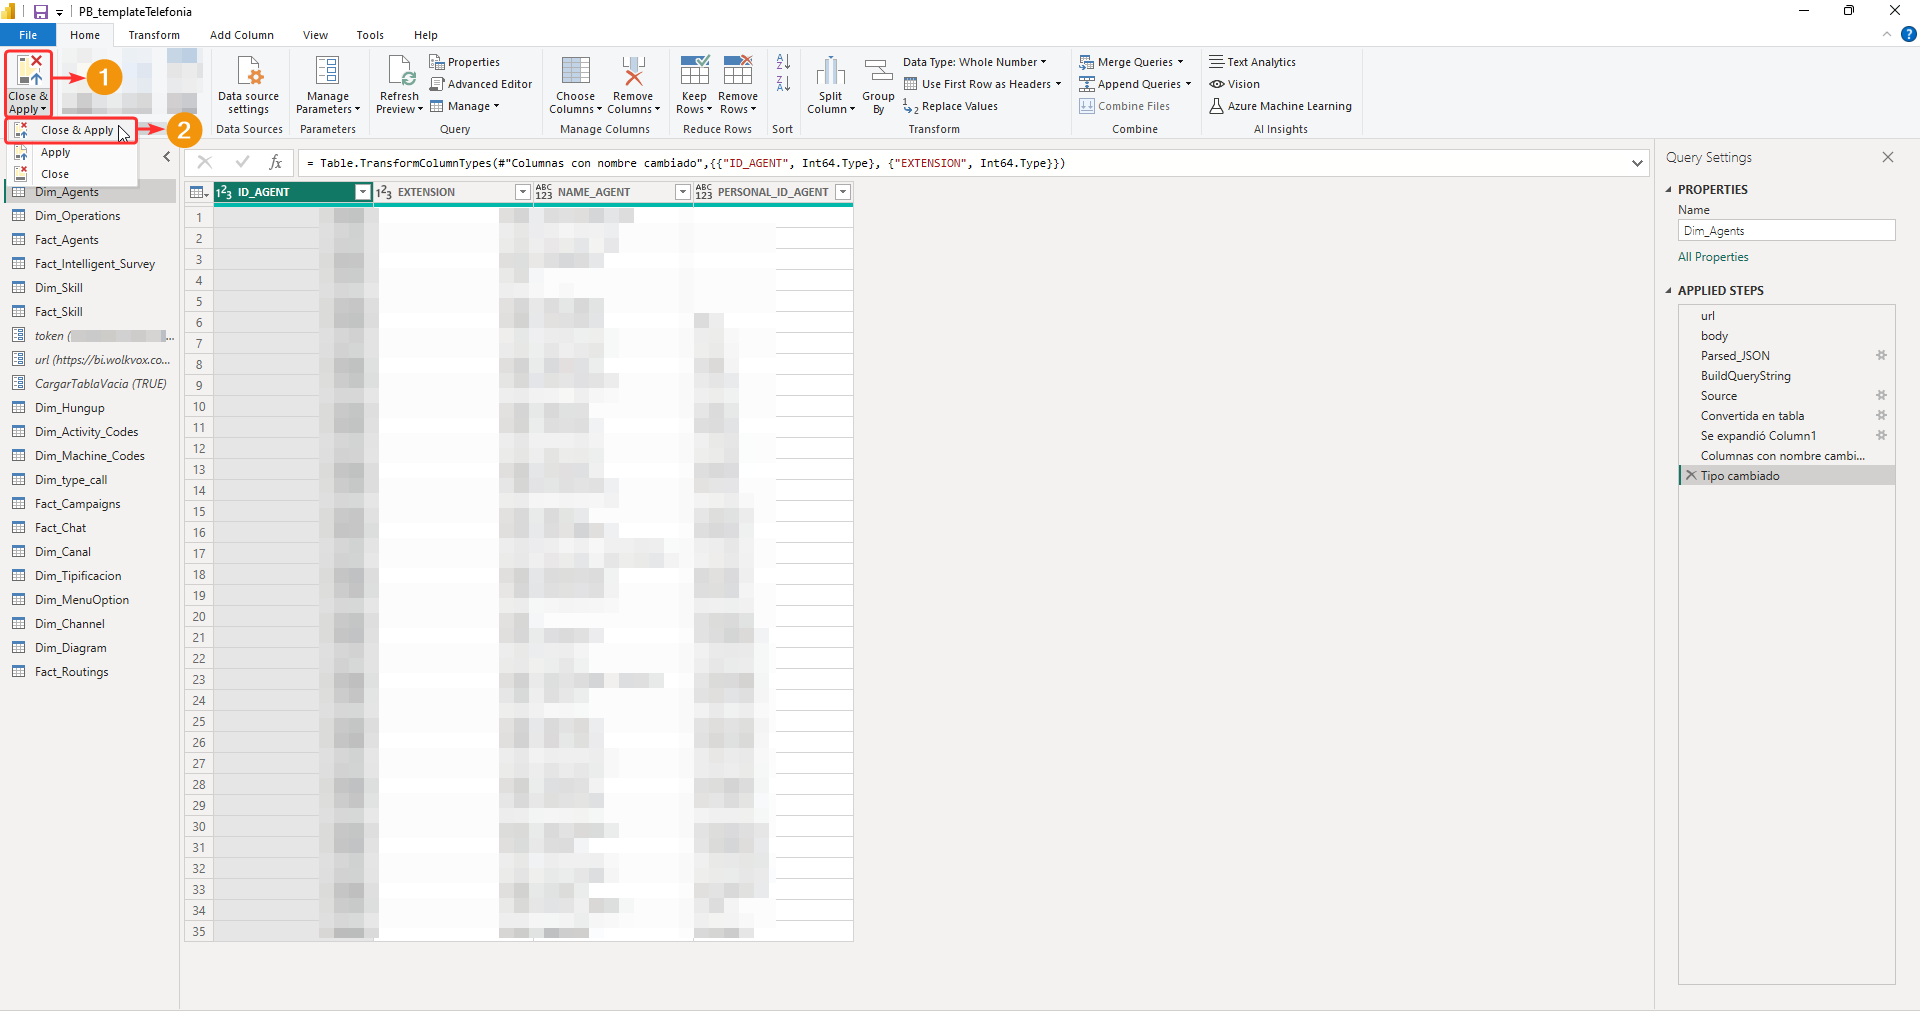
The final steps are as follows:
- Select the “Close and Apply” dropdown menu.
- Select the “Close and Apply” option.
Note: This process avoids errors when loading the data.
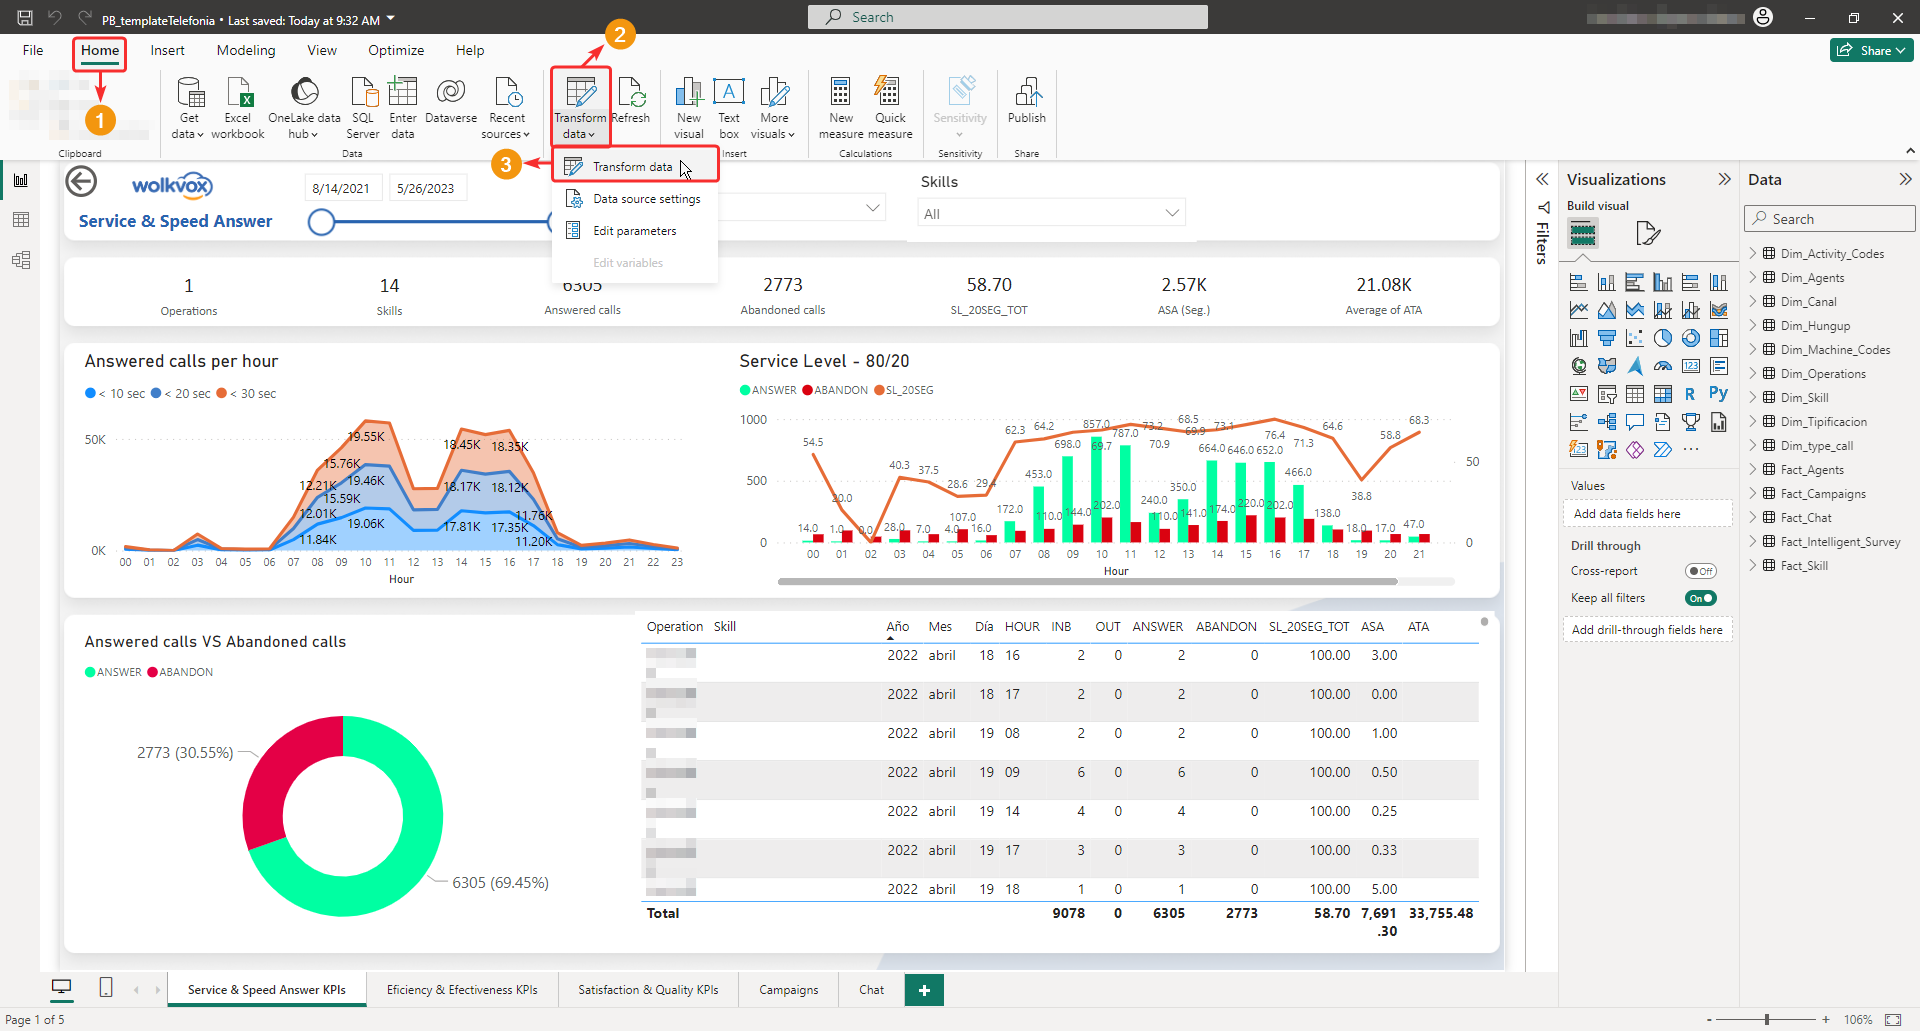
The first thing you will see is a template with charts and tables previously designed by wolkvox, to make it easier for you to interpret the information.
To connect the data from your operation with these templates, you must follow these steps:
- Go to the “Home” tab.
- Click on the arrow of the “Transform Data” button.
- Select the option “Transform Data”.
Next, you will see the following window where you should look for the option “token” in the “Queries” column. To connect your operation’s data, you should enter the token provided by the wolkvox Manager application at the time of activation and selection of the “Power BI” visualization layer.
To enter the token, you only need to input its code in the “Current Value” field.
You can also enter in “Manage Parameter”, a window will open, and there you will find the same “Current Value” field.
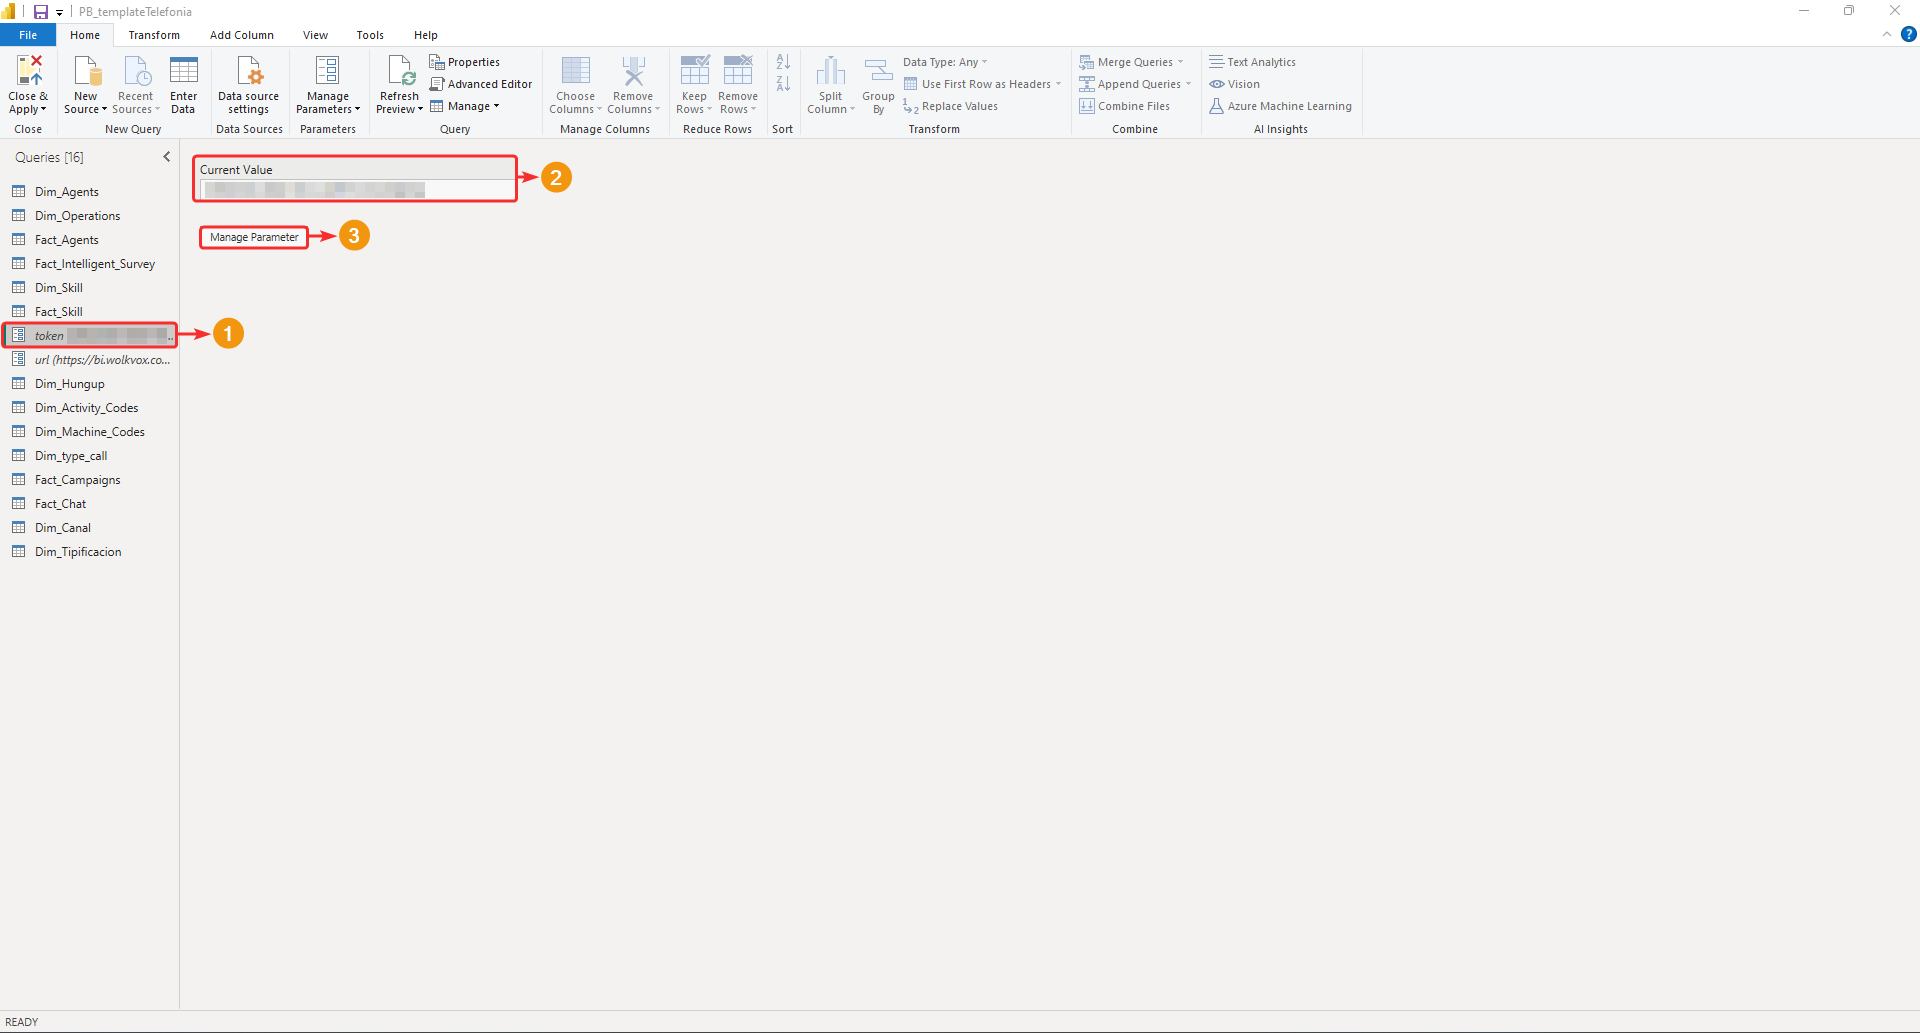
- If you enter “Manage Parameter,” you will find the same “Current Value” field in the window to enter the integration token provided by the wolkvox Manager application.
- Click on “OK”.

When you have correctly entered the token, click on “Close & Apply.”
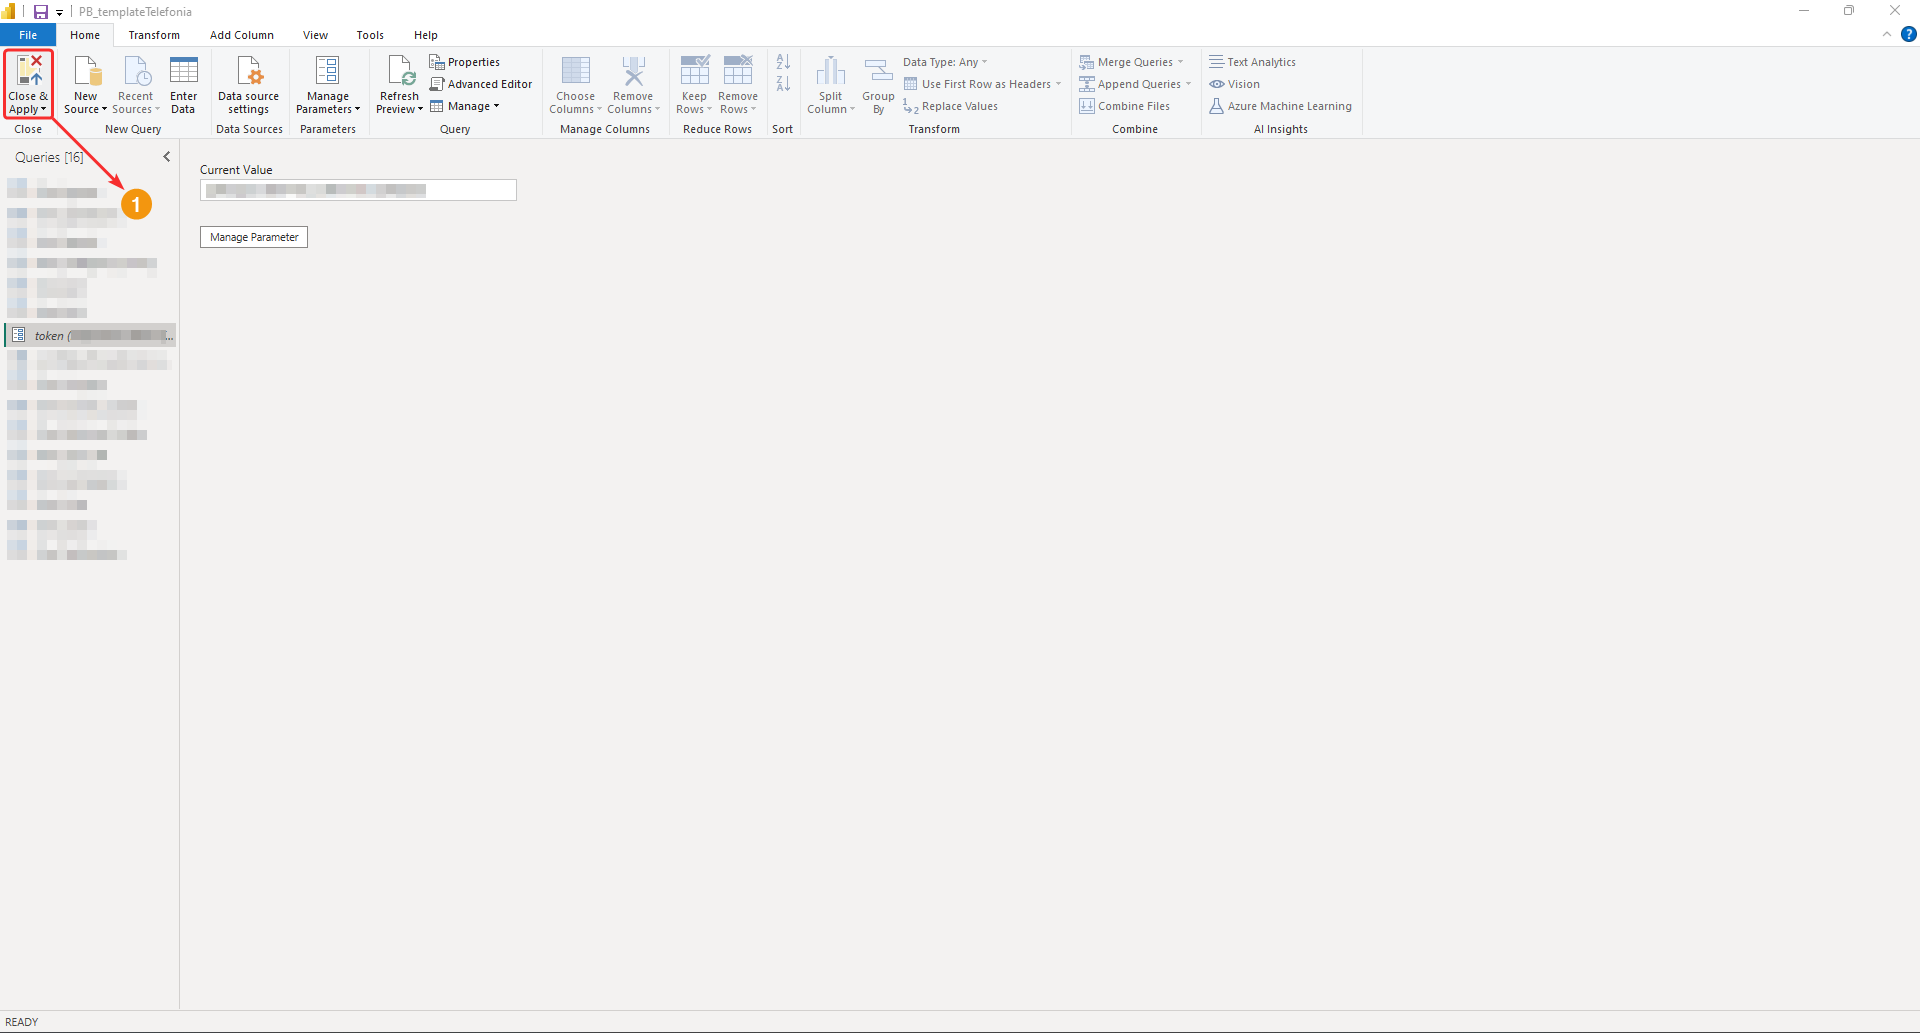
At the top, you will see a horizontal ribbon with the “Apply changes” button. Click on it.
A window will appear with the data loading process. Also, a window with credentials to access the web content will appear. You can enter as “Anonymous”. Then, click on “Connect”.
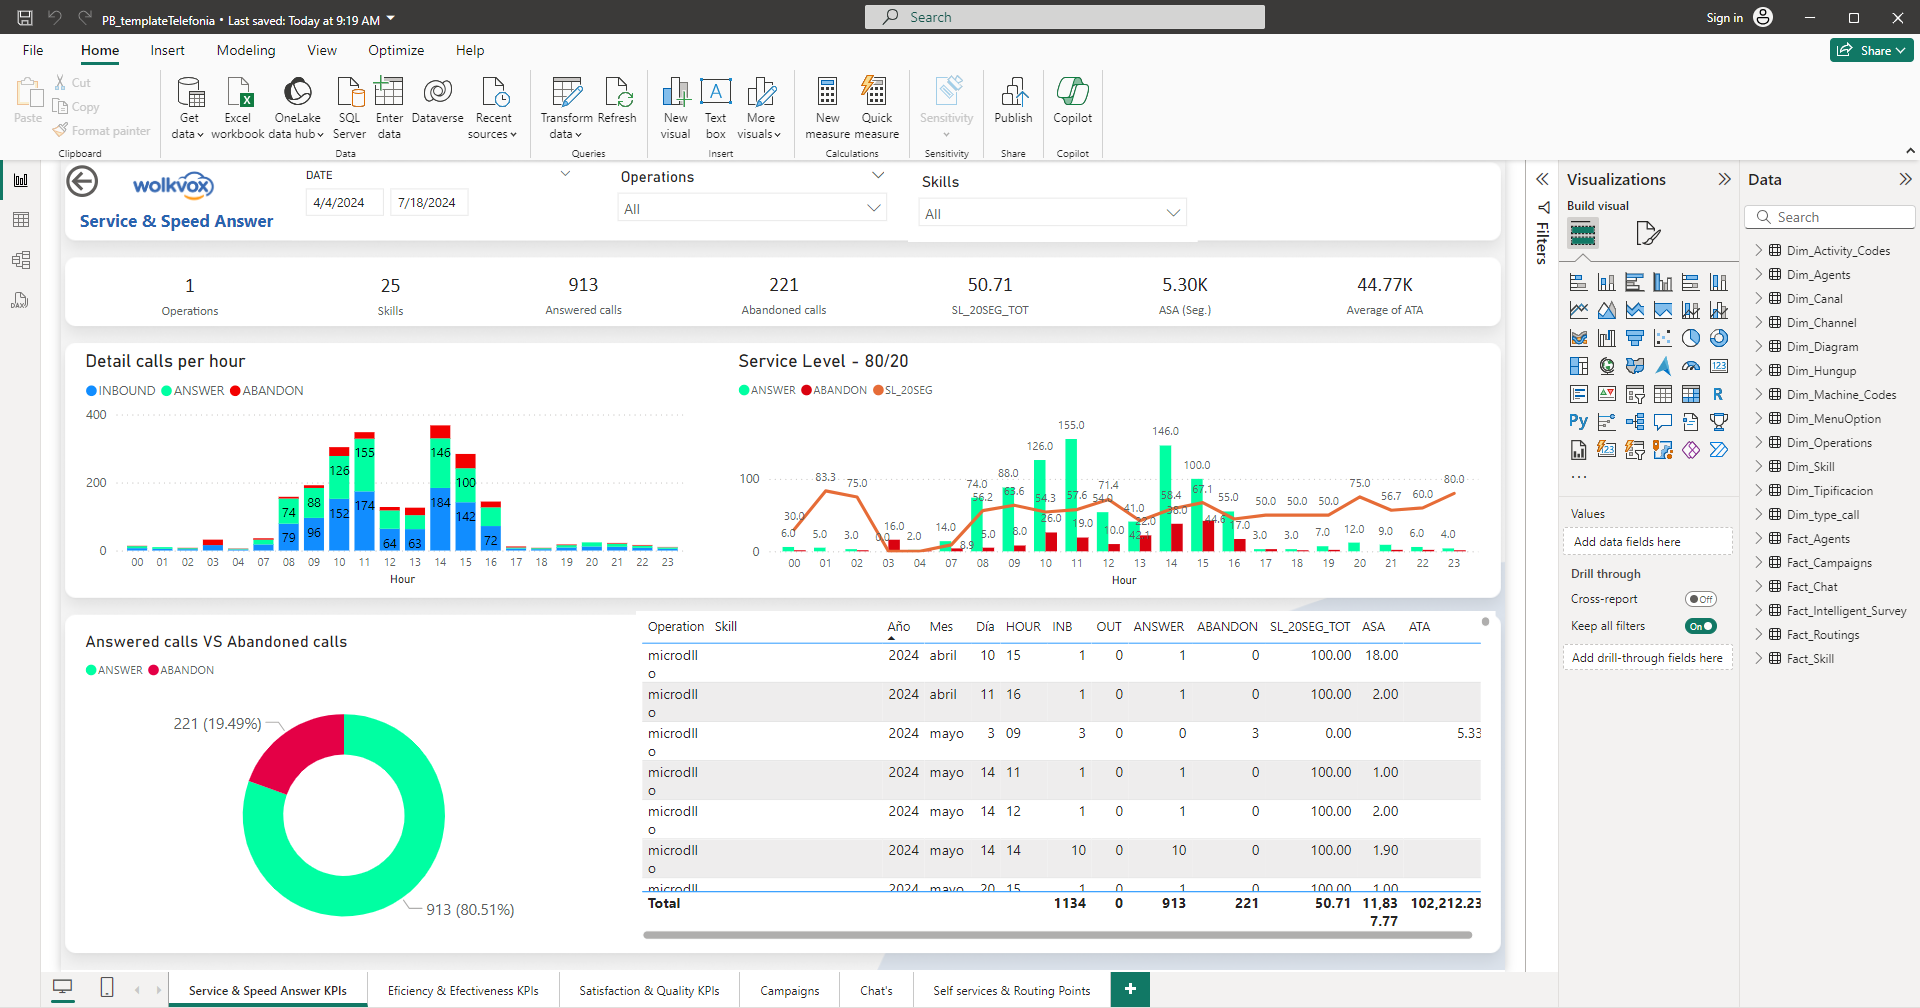
After connecting, you can navigate through this large informative dashboard provided by Wolkvox BI in Power BI. Visualize all the data it provides and switch between the tabs “Service & Speed Answer KPIs”, “Efficiency & Effectiveness KPIs”, “Satisfaction & Quality KPIs”, “Campaigns” and “Chats” according to the data you need.
Important: remember that you will start visualizing information about your operation when you complete the first hour of product activation. The information you will see from that moment is the data from the first day of a four (4) month time range.