

In the Dashboard panel, you can view real-time reports about your operation. There are 6 tabs that you can access to check information on: Agents, Skills, Campaigns, Speech Analytics, Gamification, and Chat & Interactions.
Note: The number of tabs that appear in this section will depend on the number of services you have activated.

Real-time agent statistics #
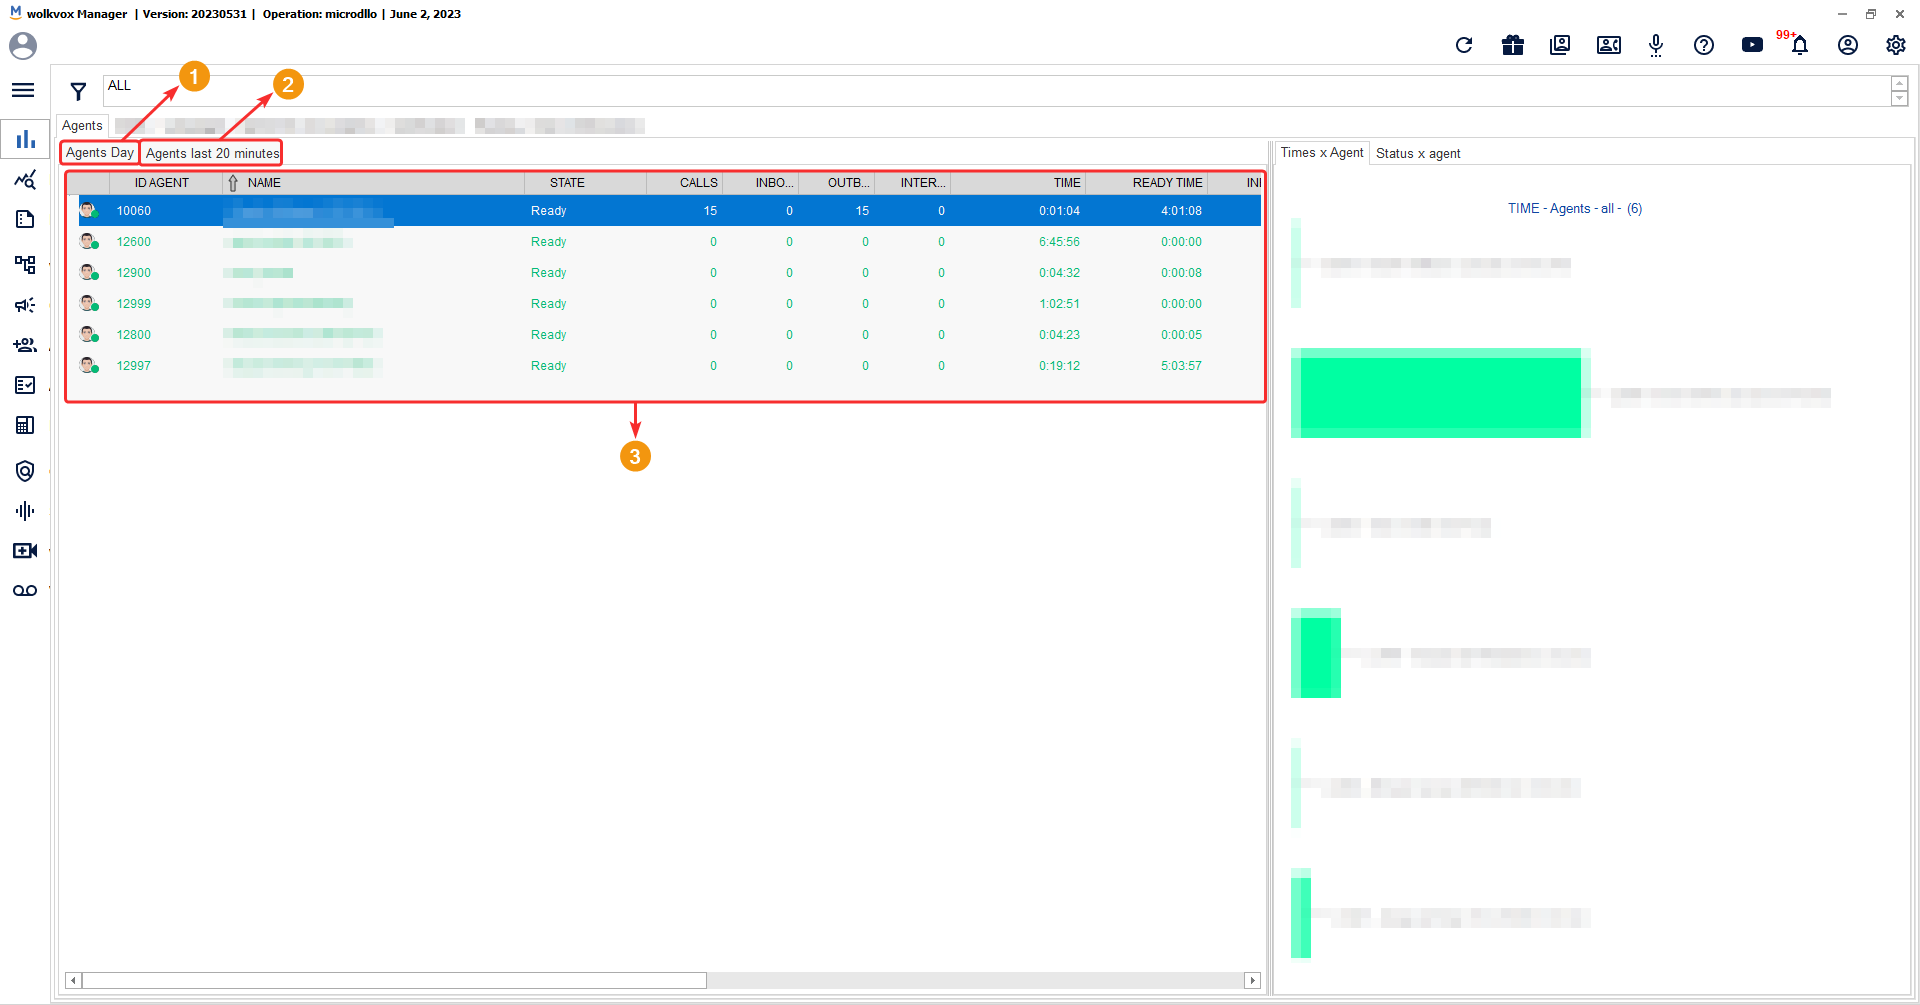
The first tab of the Dashboard called “Agents” allows you to view real-time statistics that are very important about each agent currently connected. The data you obtain includes:
- Agent ID: Agent’s extension number.
- Name: Agent’s name.
- Status: Agent’s current status.
- Calls: Number of calls made by the agent during the day.
- Inbound: Number of inbound calls.Outbound: Number of outbound calls.
- Internal: Internal calls.
- Time: Time the agent has been logged in.
- Ready time: Time the agent has spent in “Ready” state.
- Inbound ATT: Conversation time for inbound calls.
- Outbound ATT: Conversation time for outbound calls.
- N-ready ACW: Time the agent has spent in ACW (After Call Work) state.
- Aux time: Time the agent has spent in auxiliary state.
- Ring time: Time the agent has spent waiting to attend to a customer.
- Login time: Time the agent has been logged in.
- AHT: Average handling time for the agent, which counts from the beginning of a call until the completion of its categorization.
- Occupancy: Agent’s occupancy percentage, measured by the time spent on calls and categorization.
- RPC’s: Number of calls the agent has successfully made to the line’s owner.
- Hit’s: Number of successful calls that have been categorized as positive codes.
Note: You will have two tabs: “Agents Day” where you get the real-time report that measures the indicators considering the entire day, and the “Agents last 20 minutes” tab where you get the real-time report but in this case, the indicators are measured based on the last 20 minutes.
Filter agents #
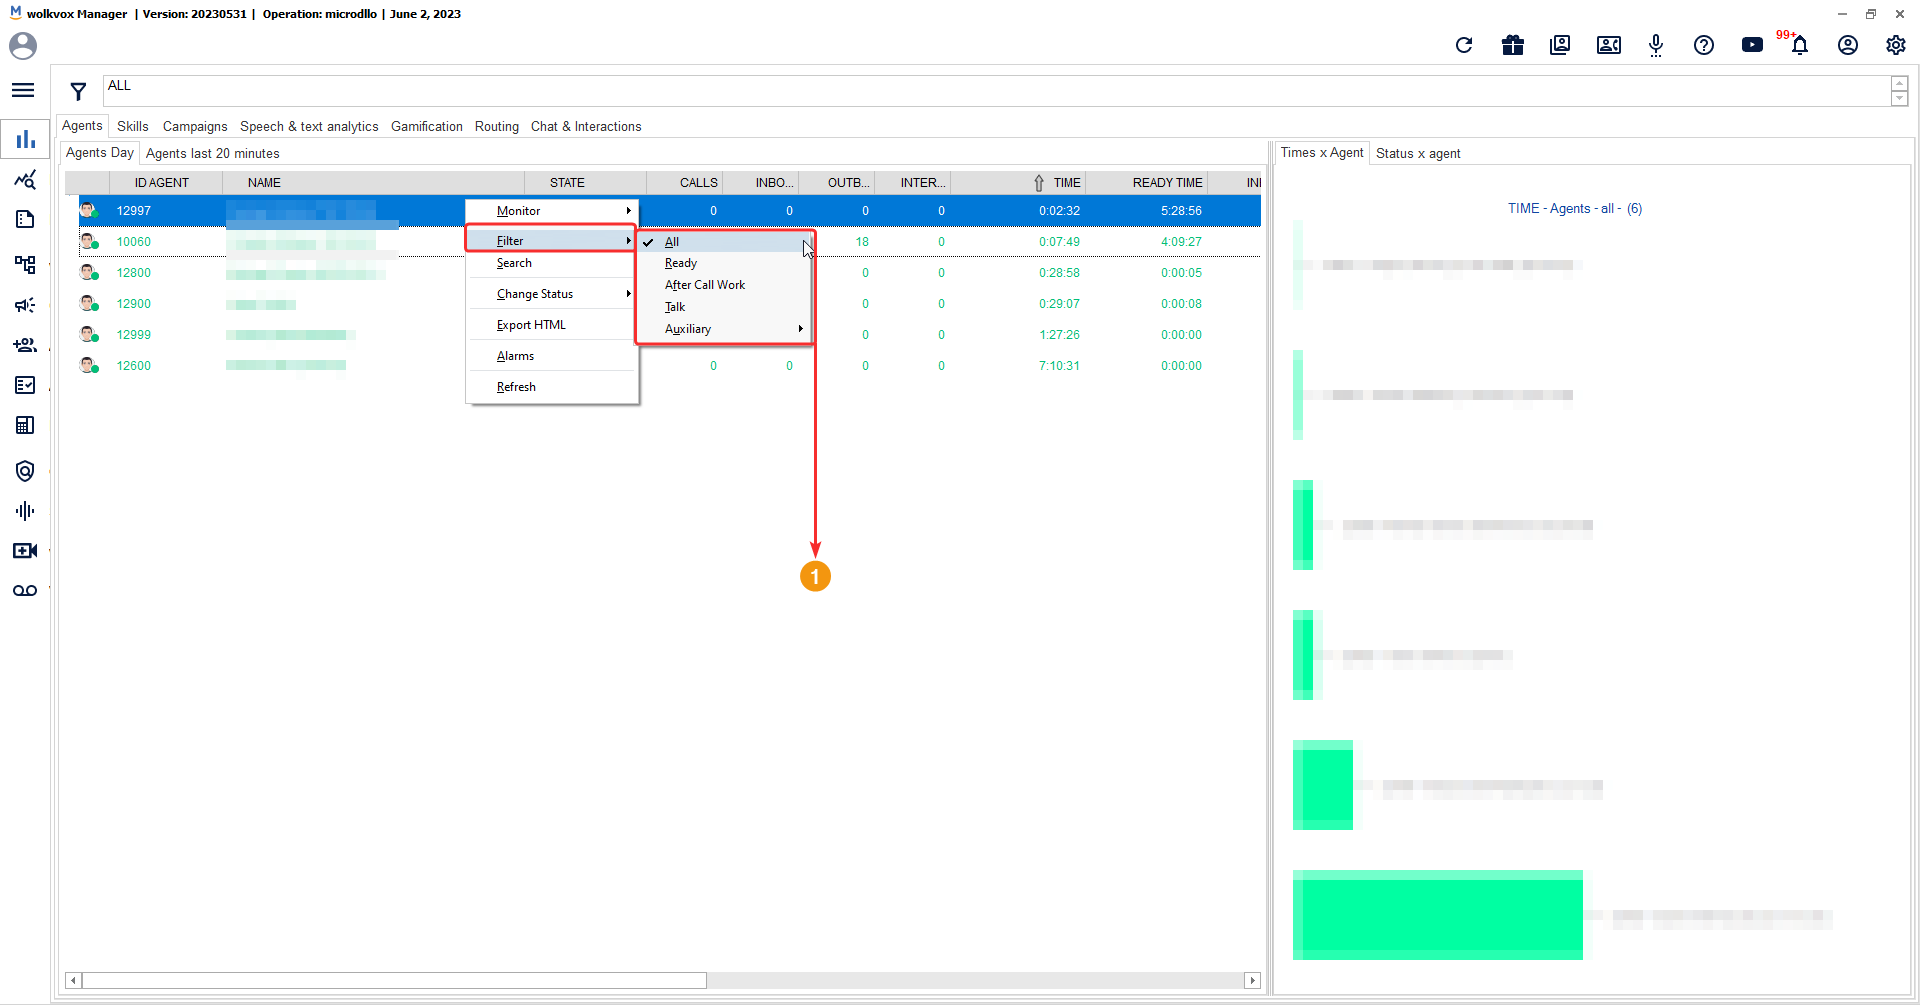
If you right-click on the Dashboard report and select the “Filter” option, you can filter the entire table by states. You can filter agents who are in the “Ready” state, “After Call Work (ACW),” “Talk,” or any custom auxiliary state you have created.
Manual search #
Another option you have when right-clicking on the agent table in the Dashboard is to manually search for an agent by typing, for example, the name of the agent you want to find.
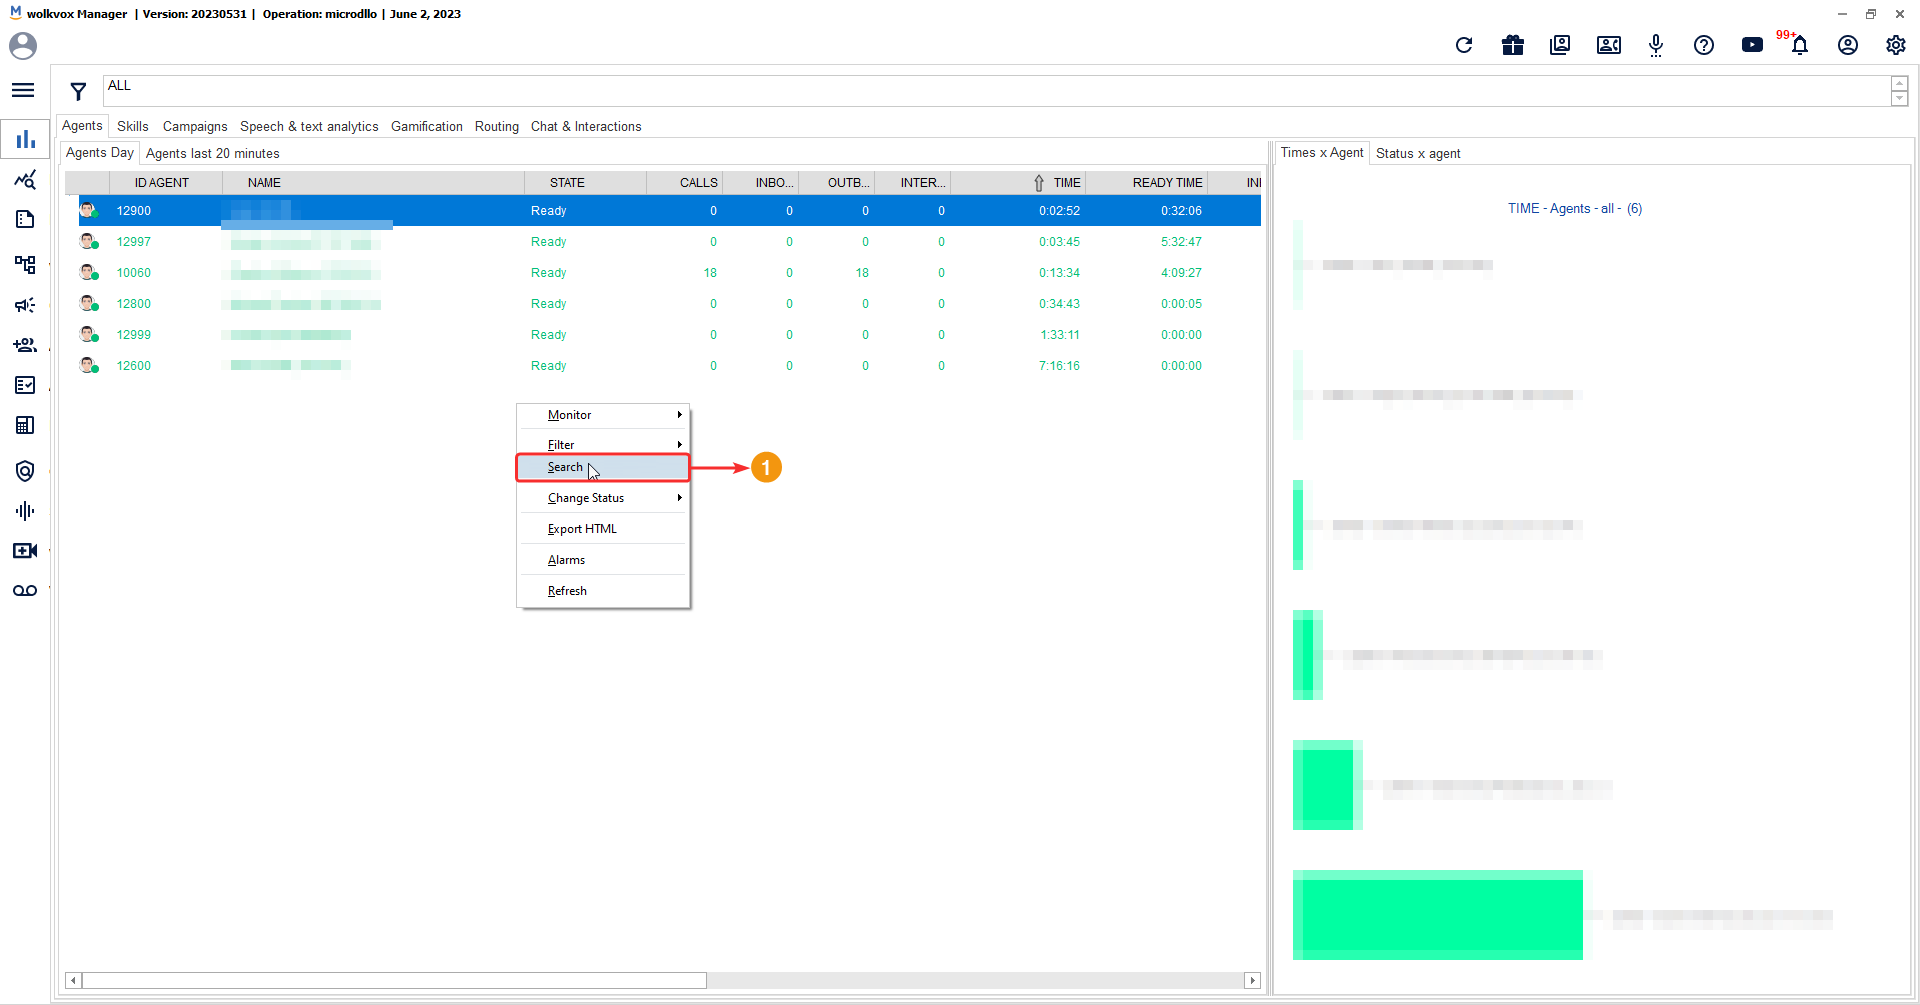
A window opens with a field to enter the name or ID number of the agent you want to find.

Change the agent’s status #
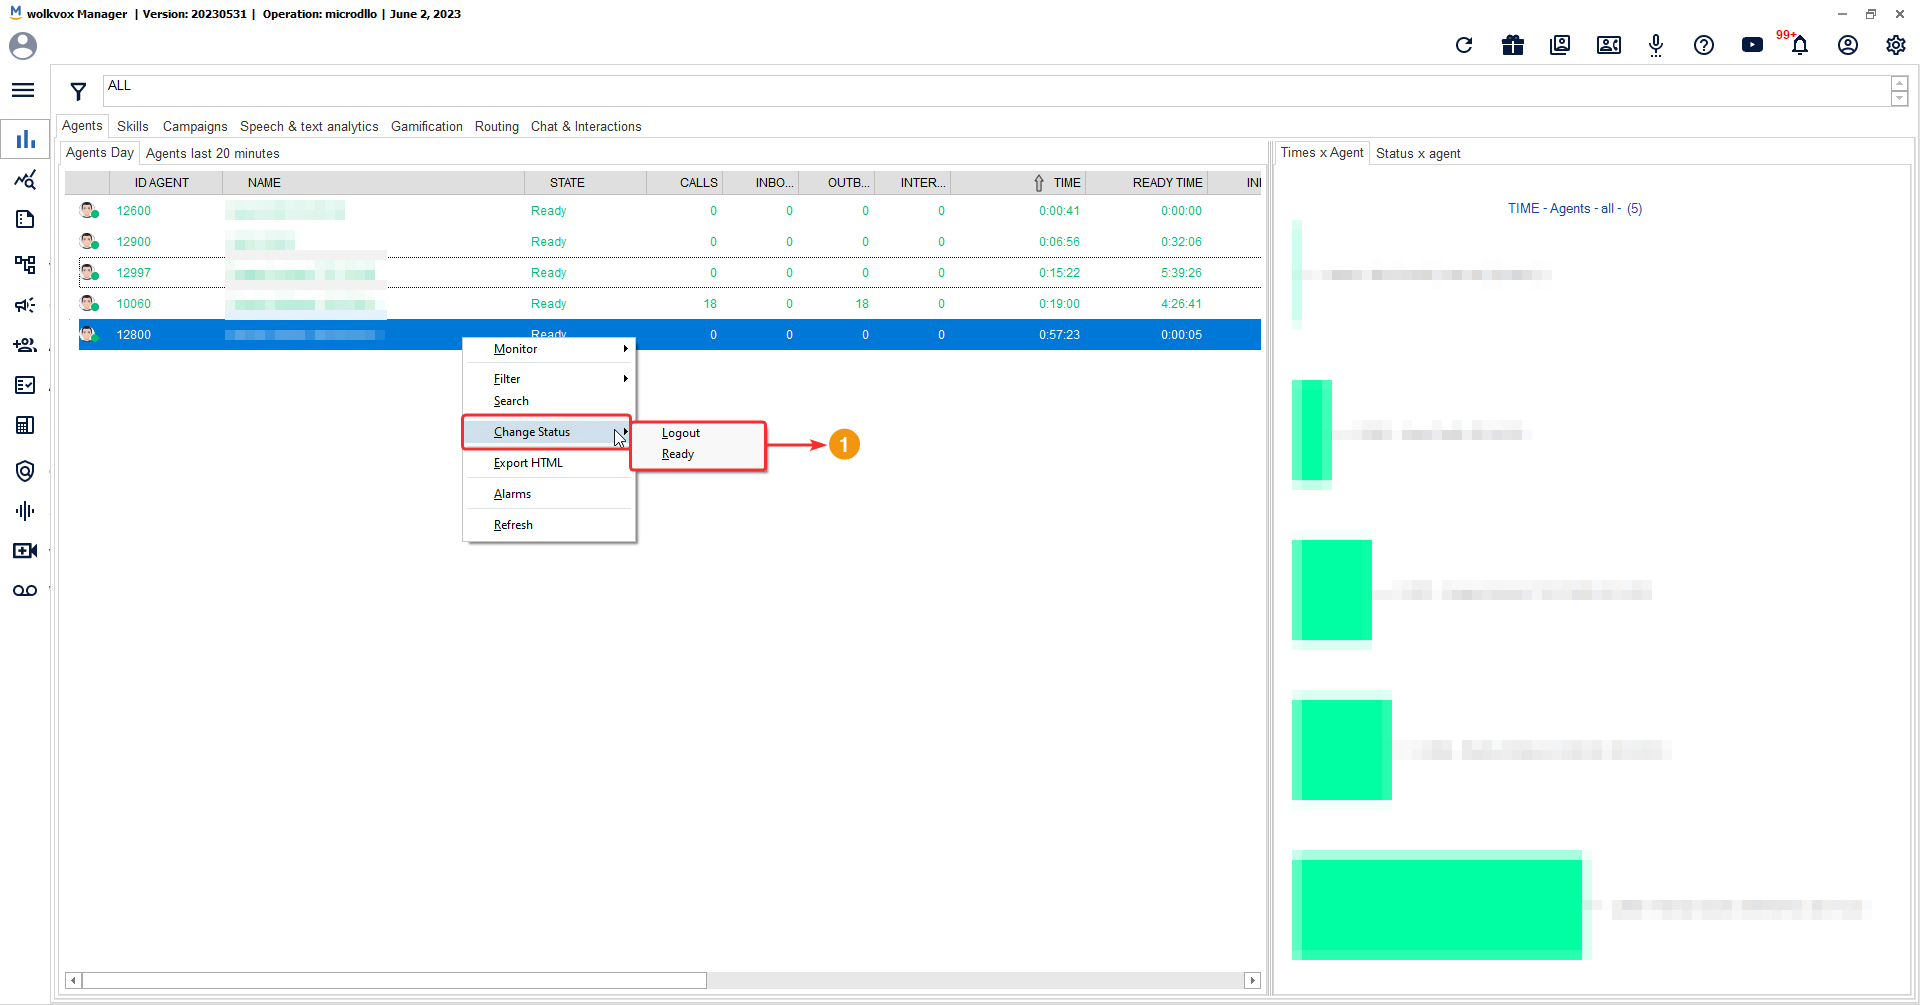
If you right-click on any agent from the list, you can change the agent’s status to “Logout” or “Ready”.
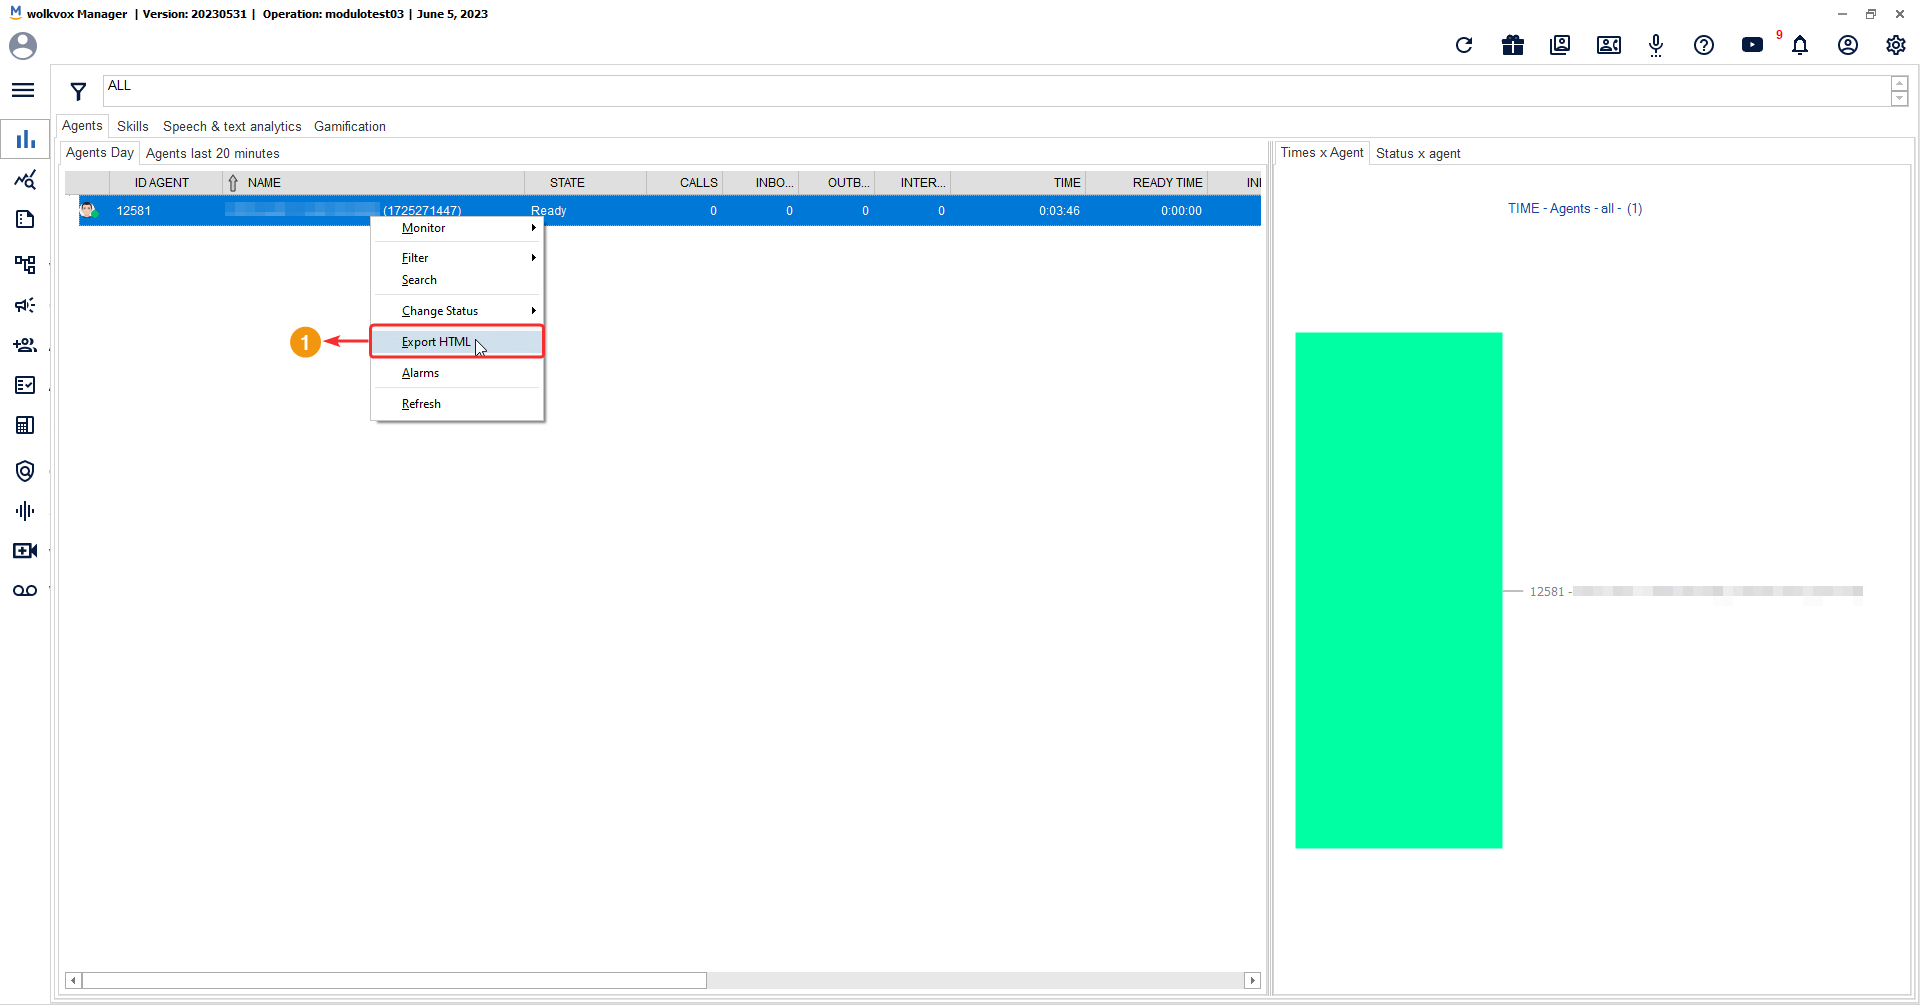
Export the real-time report to HTML #
It is also possible to export the entire table provided by the real-time Dashboard, and the HTML file will display all the data of all currently connected agents.
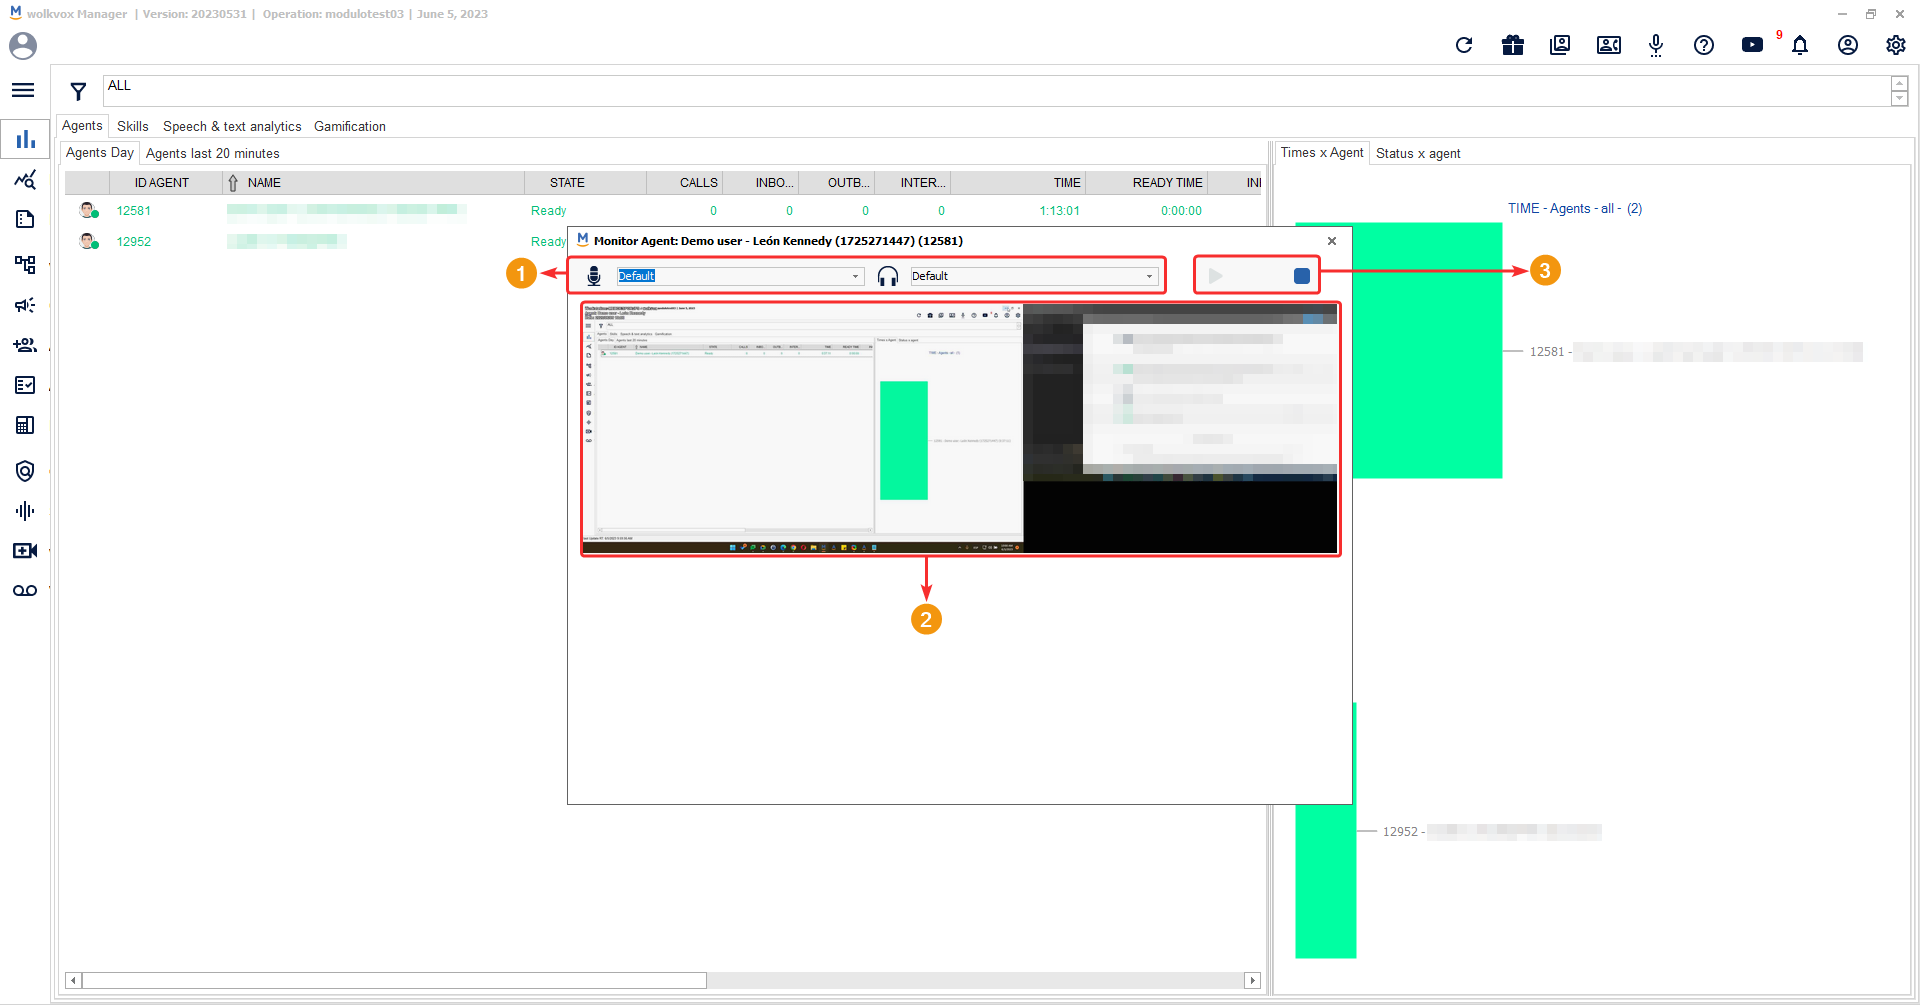
Monitor the agent’s activities #
This tool allows you to monitor the agent’s screens and listen to the conversation between the agent and the customer.

A window will open where you can view the agent’s screen or screens. You have buttons to change the input and output audio devices such as microphones and speakers or headsets. And there is a “Stop” button to stop viewing the agent’s screen, and the “Play” button to resume viewing the agent’s screen if it has been closed.
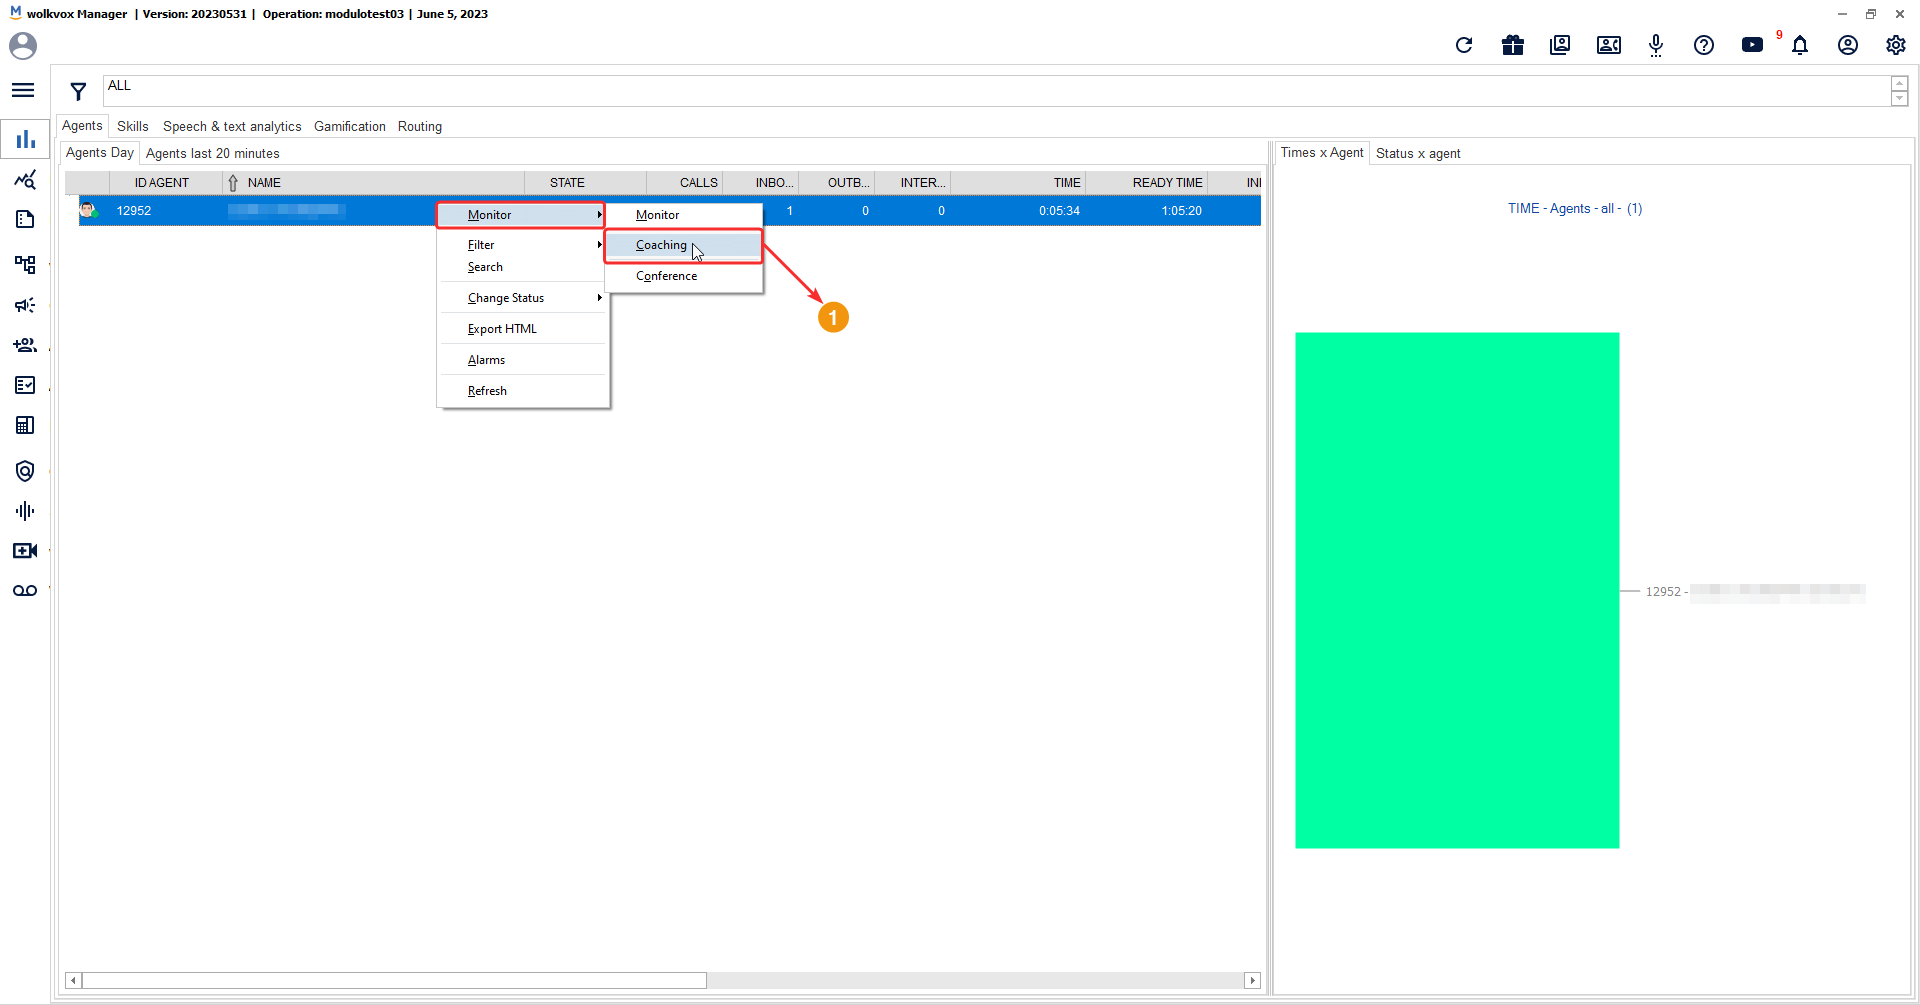
Communicate, train, and collaborate with the agent through the coaching tool. #
This tool will enable you to assist the administrative team of your operation in improving agent performance by providing agent training, monitoring real-time performance, and fostering effective communication. All of this results in better customer service and increased operational efficiency.
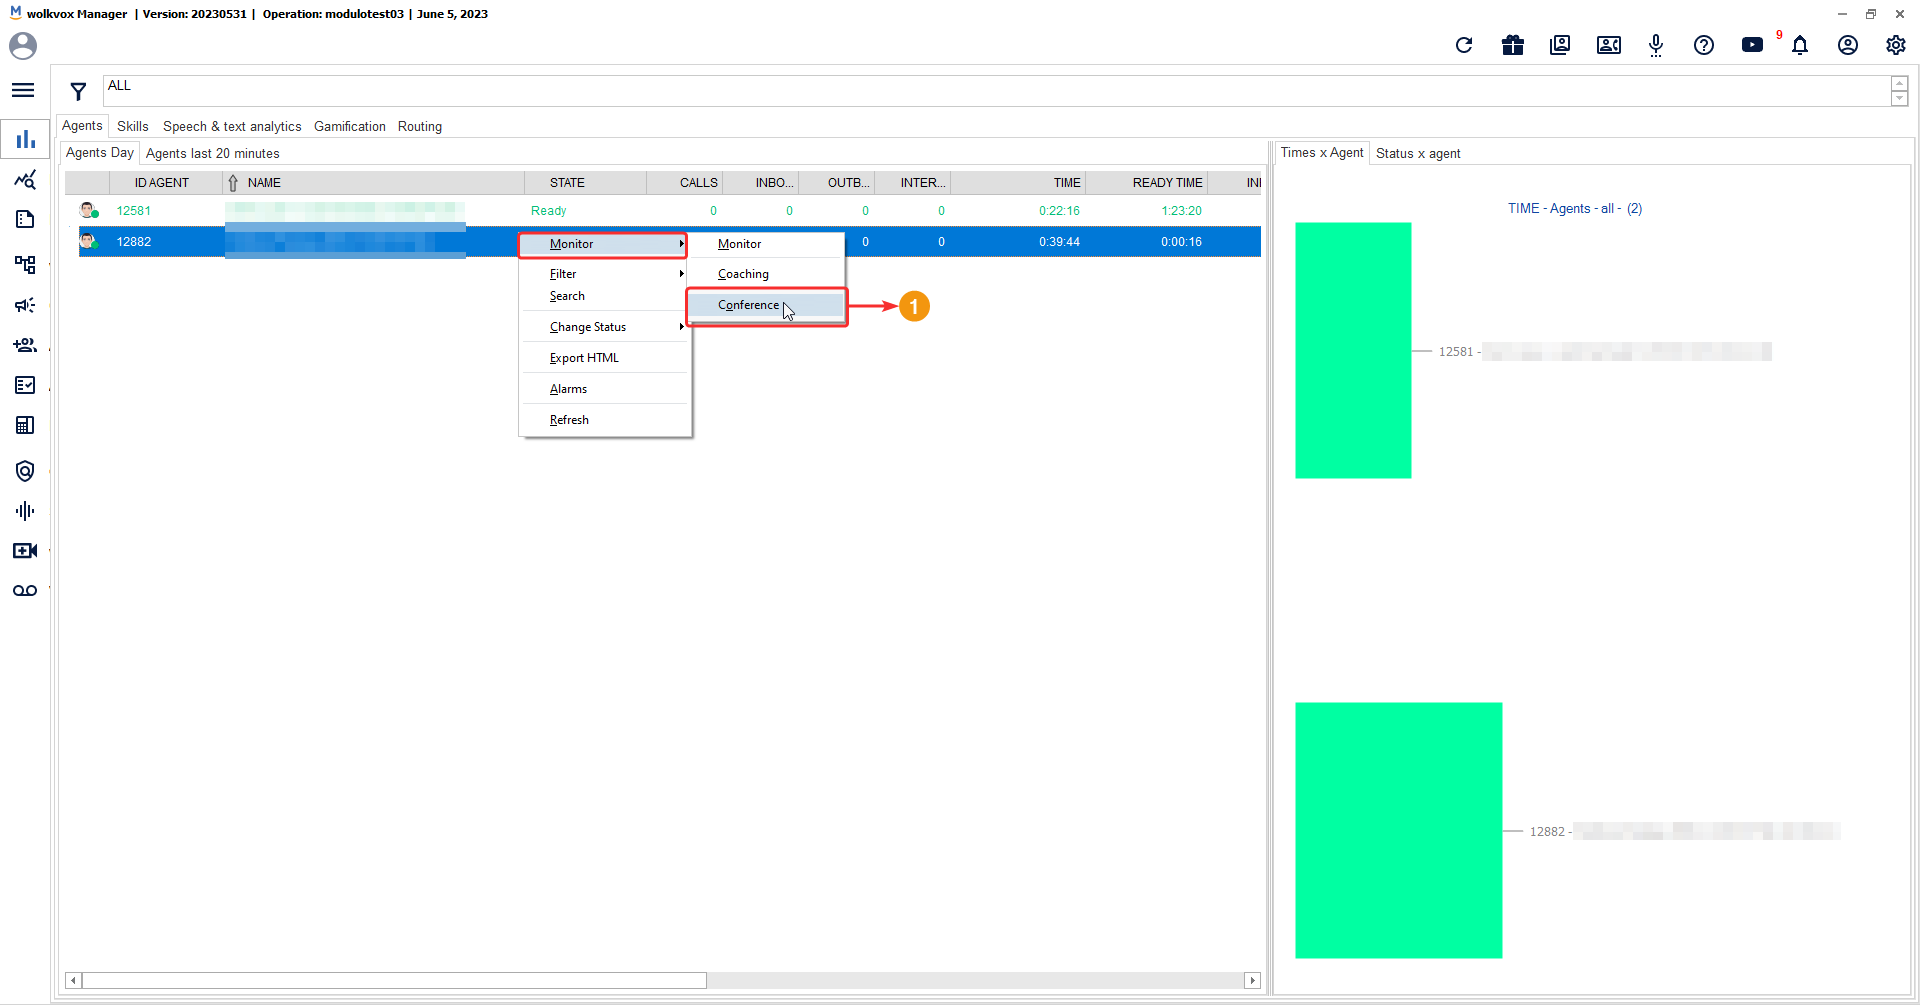
Create conferences with your agents #
This tool will allow administrators to join agents and clients, which can be useful in various situations. Agents have a button in their Agentbox application for each phone line that allows them to bring the customer into the conference room. This tool can be useful, for example, for problem resolution that the agent may not be able to solve on their own, handling escalated cases, among other scenarios.
Times x Agent #
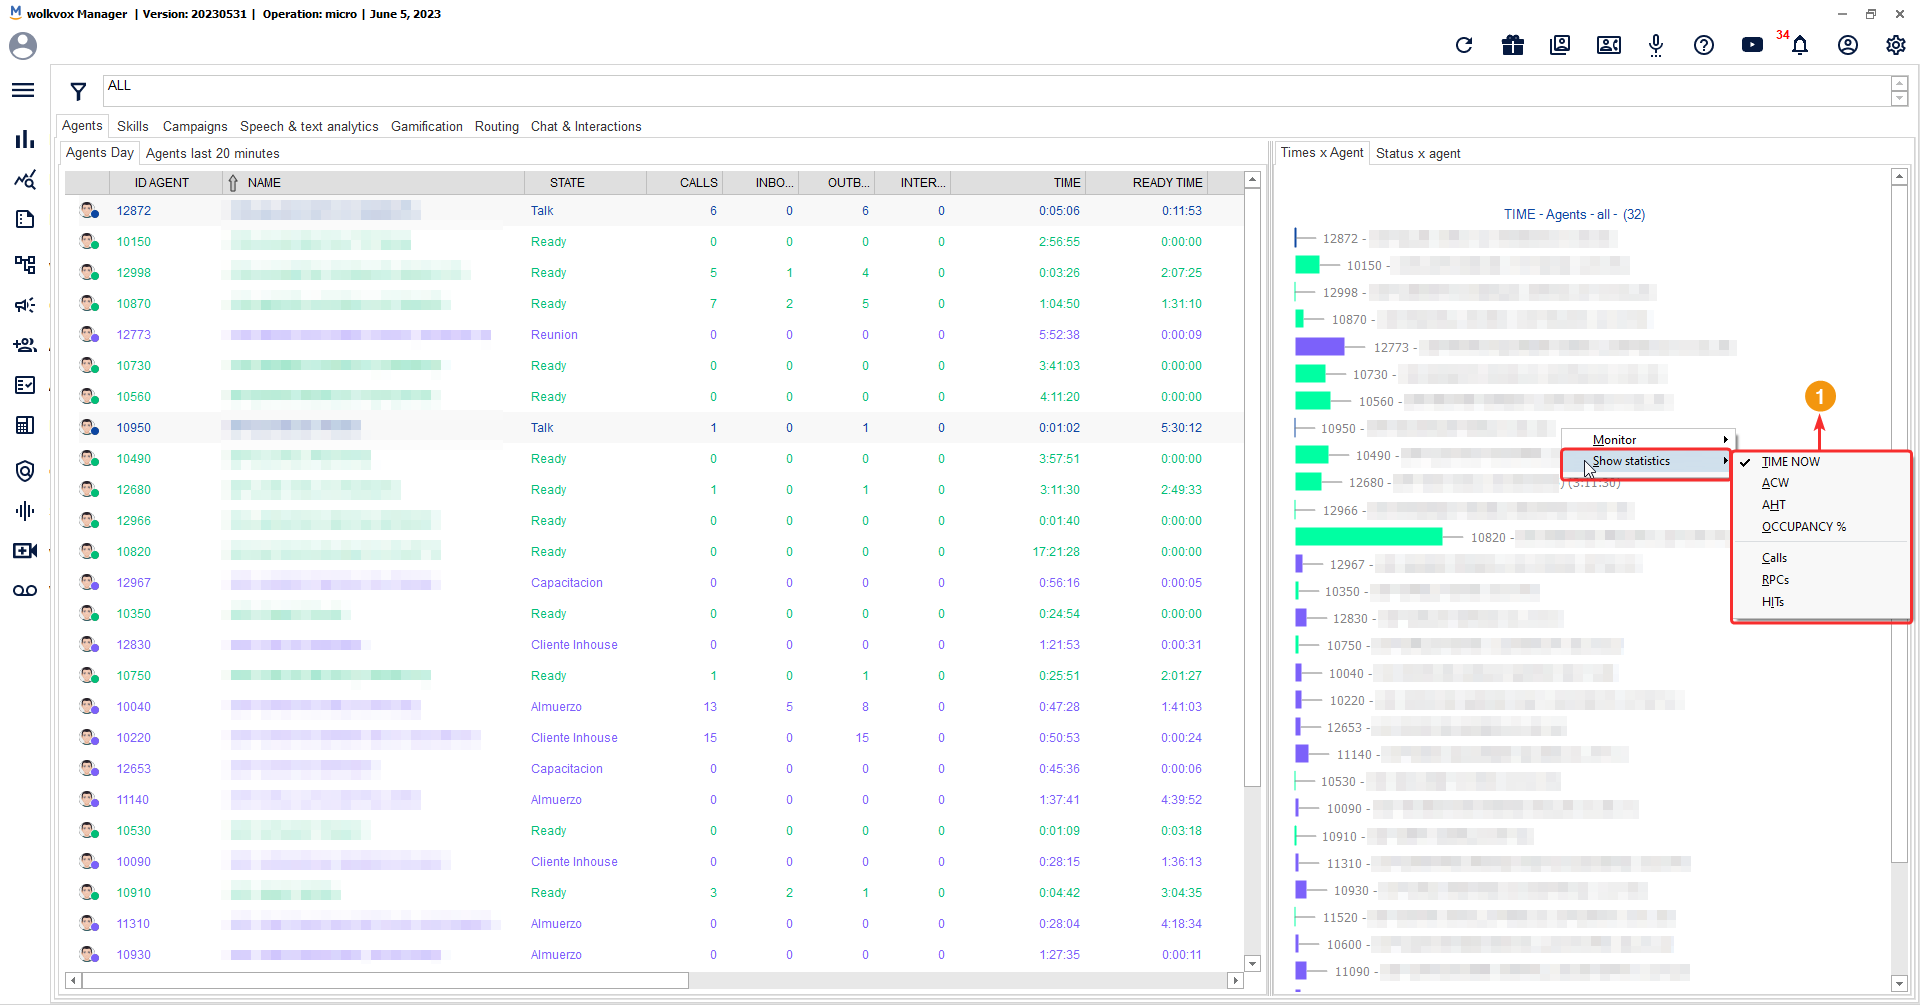
Through this tool, you can view real-time statistics of agents in the form of bar graphs and different types of reports such as current status, ACW (After Call Work), AHT (Average Handle Time), occupancy percentage, number of calls, RPC (Right Party Contact), and HITs (Successful call).

If you right-click on the statistical report, you can click on “Show statistics” and then select the report option you need to view. The options are:
- Time now: Allows you to view statistics of the current states.
- ACW: Agents currently in the “After Call Work” state and shows how long they have been in it.
- AHT: Stands for “Average Handle Time,” which refers to the time consumed by the agent in each call plus the time spent on call coding.
- Occupancy %: Displays the percentage of occupancy for each agent.
- Calls: Shows the total number of calls made.
- RPC’s: Displays the number of calls made where agents successfully contacted the phone number holder, i.e., the call was not answered by someone other than the owner of the telephone line.
- HIT’s: Shows the number of effective or successful calls made. The definition of this may depend on the configuration of each call coding or categorization code.
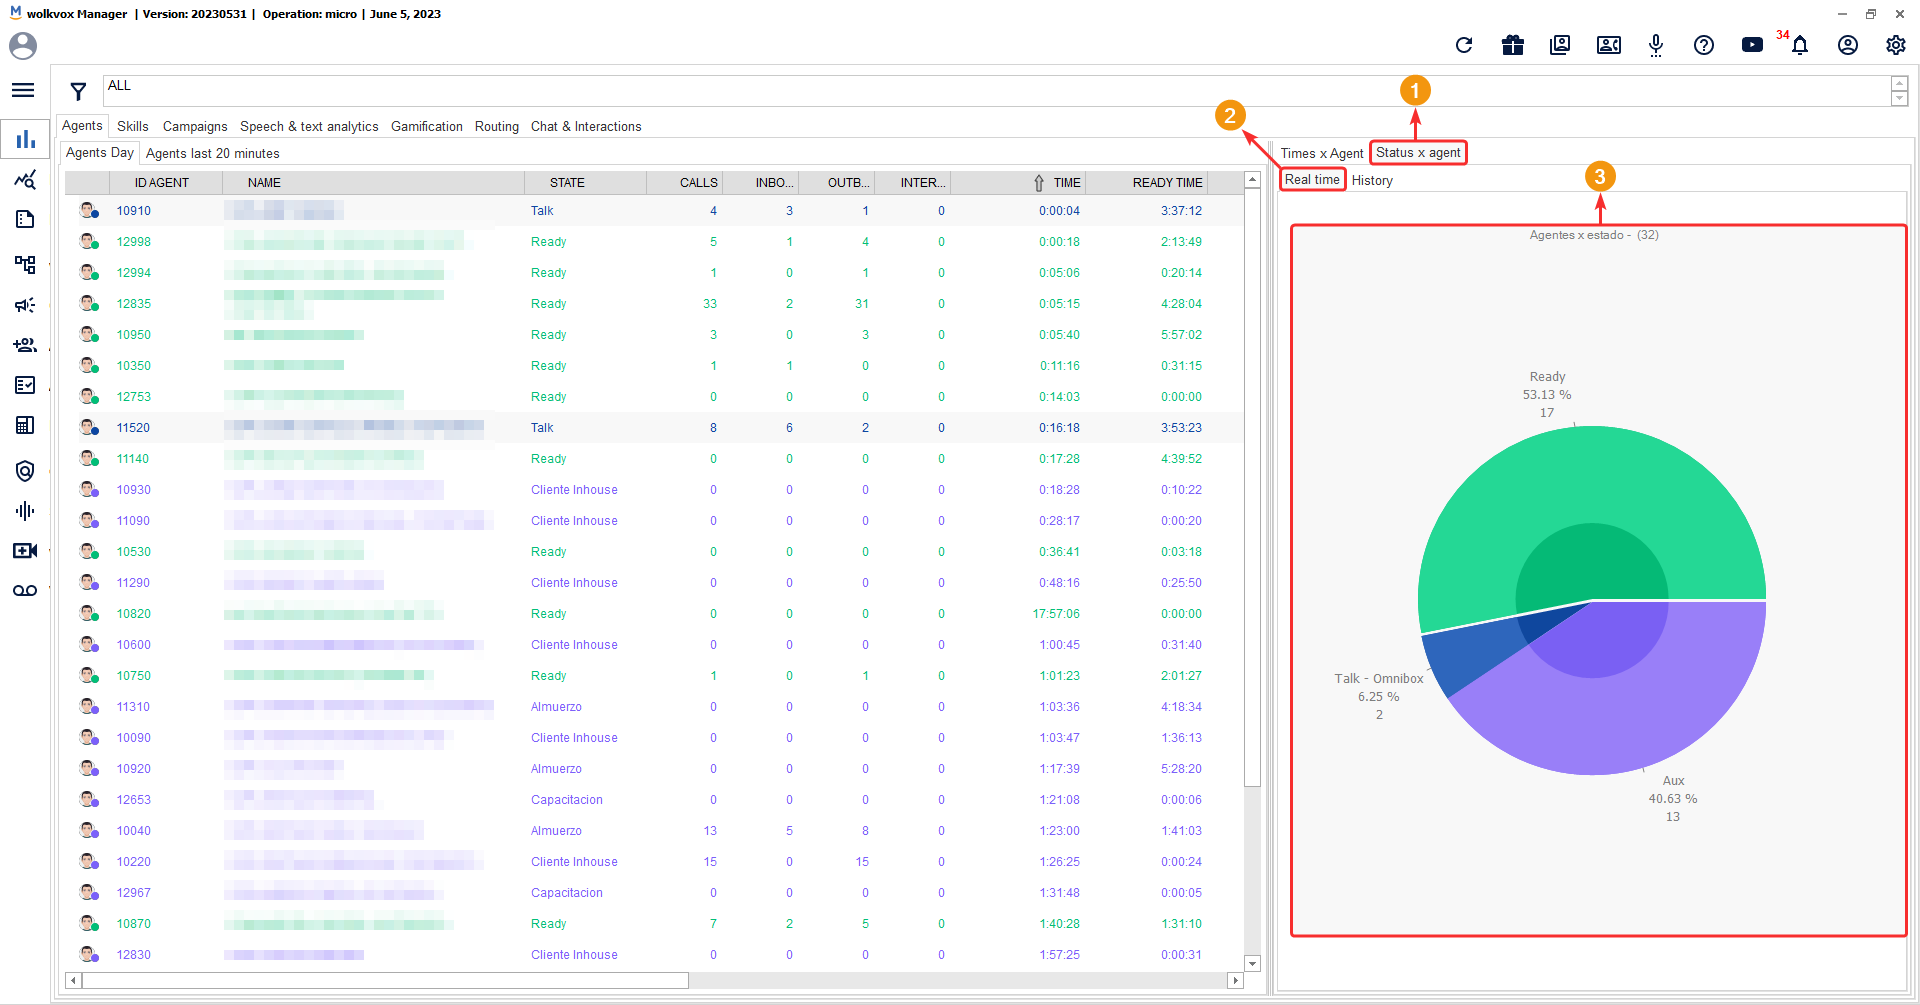
Status x Agent – Real Time #
The “Real-Time” option in the “Agent States” tab allows you to view a pie chart representing the current states of the agents. This provides a more general overview and shows the percentage of agents in each state and the number of agents in each state.
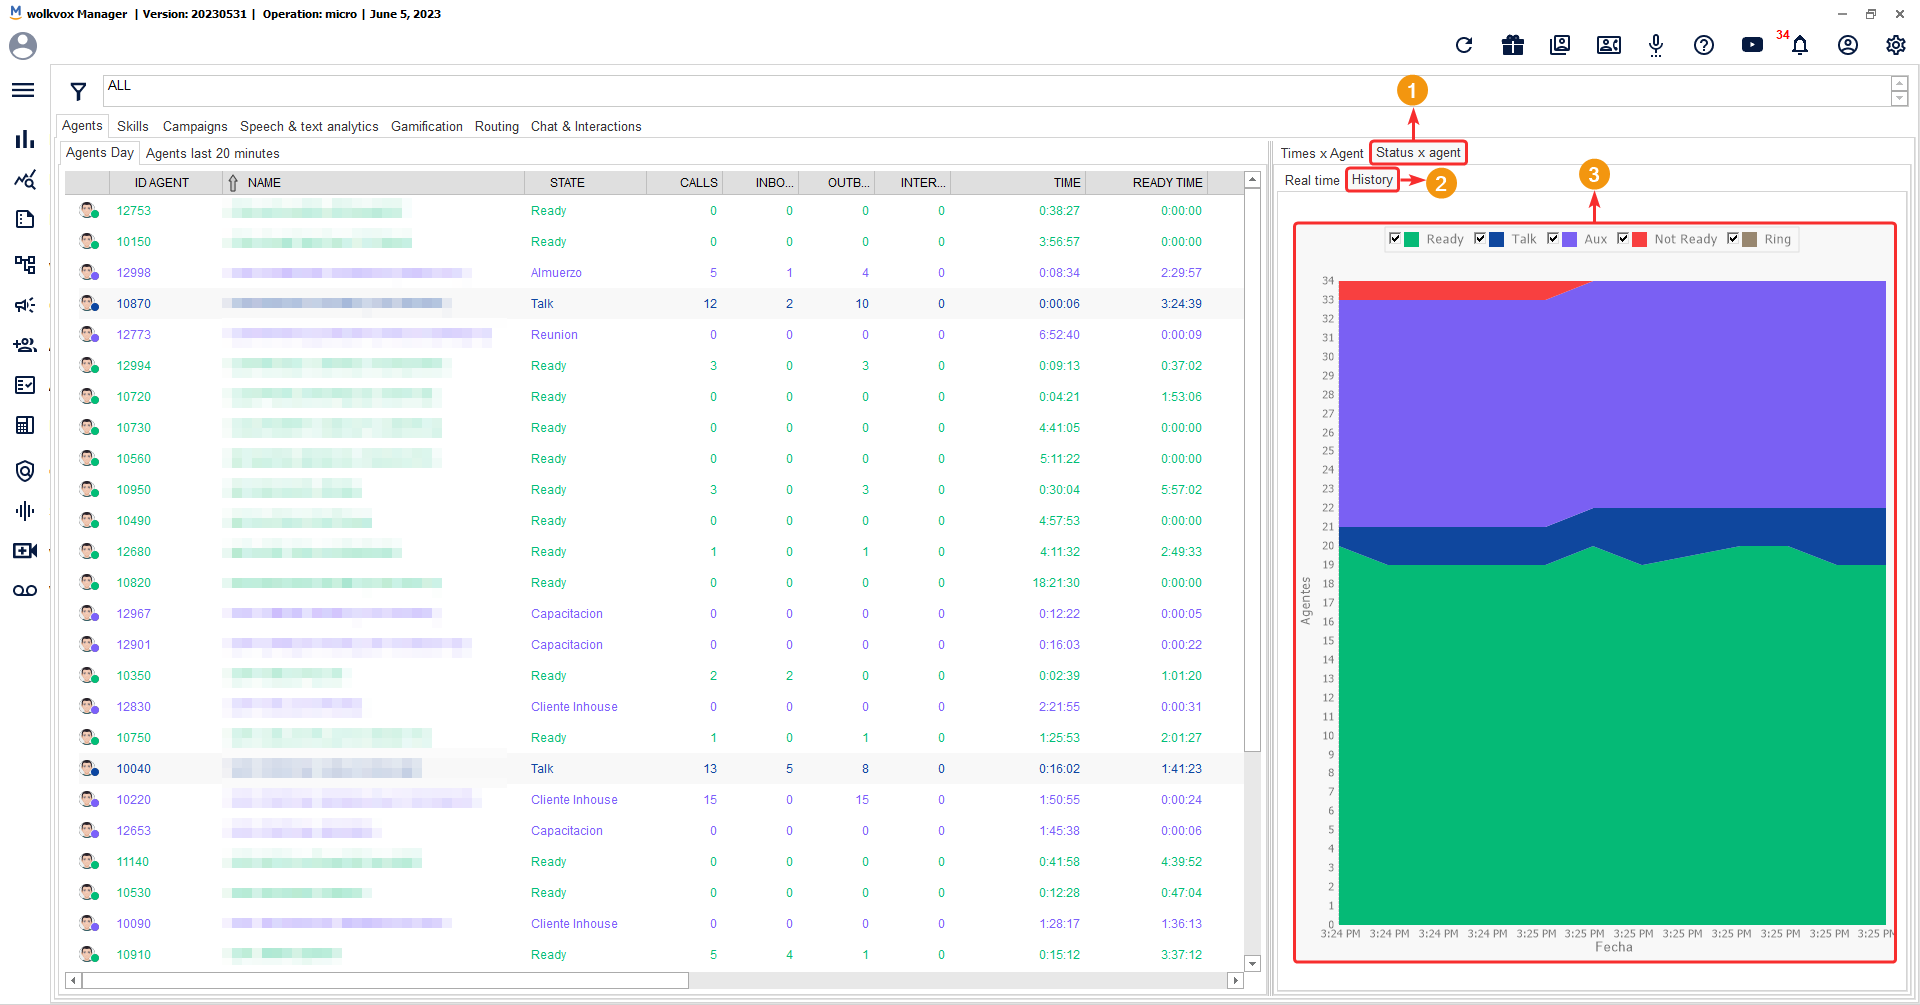
The “History” option allows you to view the overall statistics of each state throughout the day, including the time spent in the “Ring” state.
In the chart header, there are several checkboxes that you can click to include one or multiple states in the graph. The left side of the graph displays the number of agents, while the graph’s legend displays the time.
The purpose of this graph is to visualize the peaks of each state at different times of the day and compare when there are more agents in “Ready,” “Talk,” “Auxiliary Times,” and others.
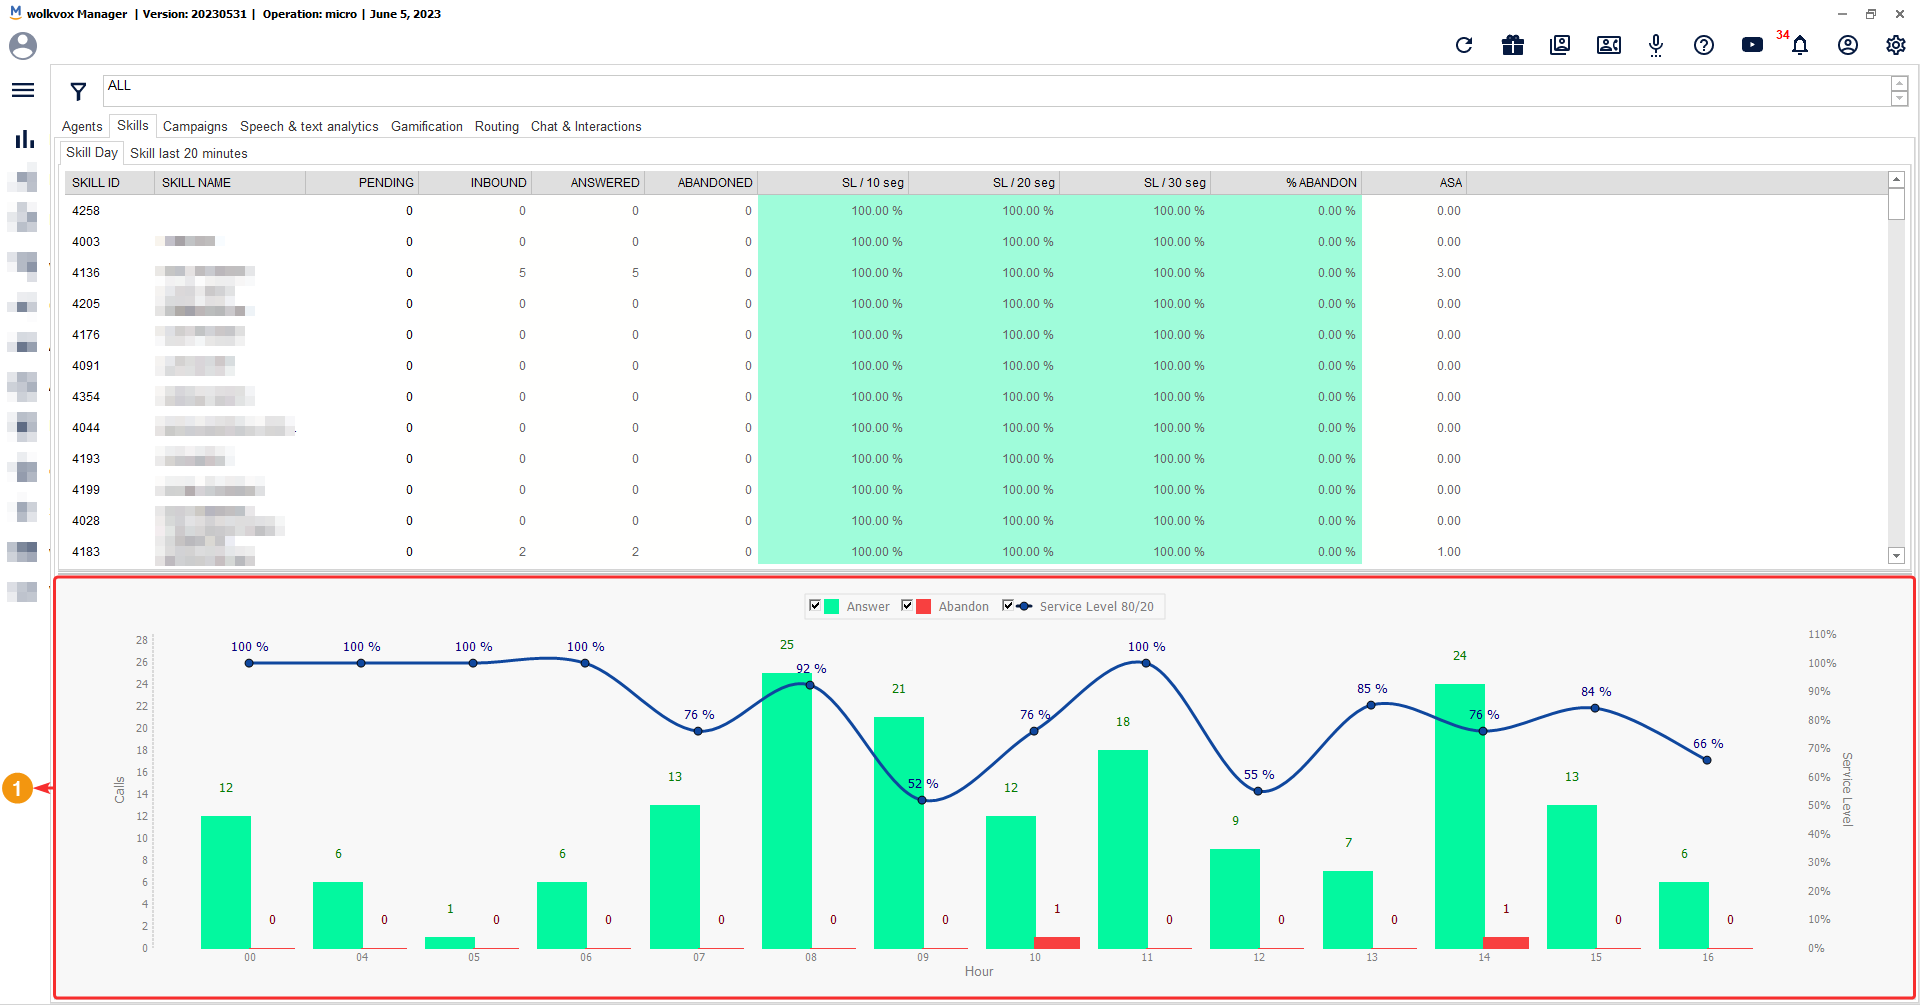
Skill statistics #
In the central table of the ‘Skills’ tab, you can view real-time or last 20-minute statistics for each skill. The table provides the following information:
- ID Skill: Skill identification number.
- Skill name: Name of the skill.
- Pending: Number of pending calls, including scheduled ones in campaigns.
- Inbound calls: Number of incoming calls made.
- Answered: Number of answered calls.
- Abandon calls: Number of abandoned calls.
- SL/10 sec: Percentage of calls answered within 10 seconds.
- SL/20 sec: Percentage of calls answered within 20 seconds.
- SL/30 sec: Percentage of calls answered within 30 seconds.
- %Abandon: Percentage of calls abandoned by the customer.
- ASA: Average time a customer has to wait to be attended by an agent from the skill.
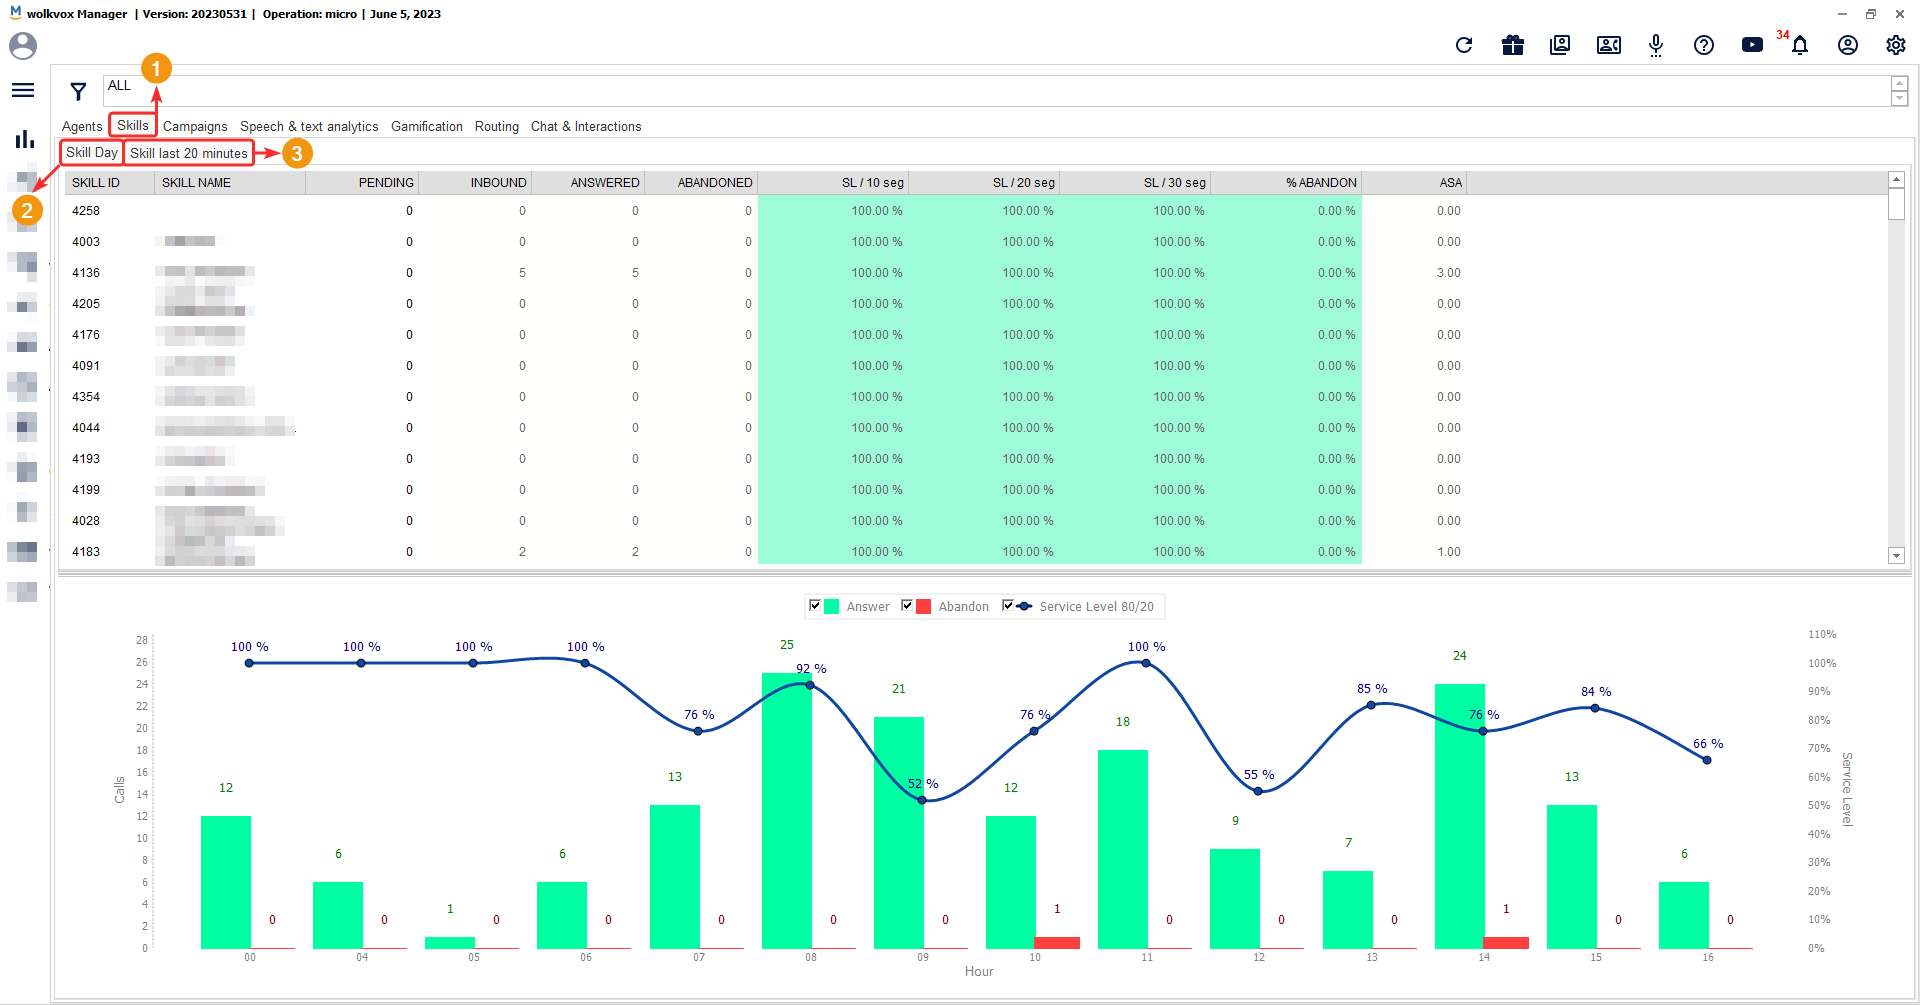
In the lower section, you can view a graph that measures the number of answered calls, abandoned calls, and the fulfillment of the 80/20 service level.
You can activate all or individual checkboxes to view the desired statistics:
- Check the “Answer” box to see the number of answered calls in the skill throughout the day.
- Check the “Abandon” box to see the number of abandoned calls in the skill throughout the day.
- Check the “Service Level 80/20” box to see the percentage of fulfillment of the 80/20 service level throughout the day. This fraction means whether the 80% of calls were answered within 20 seconds of waiting.
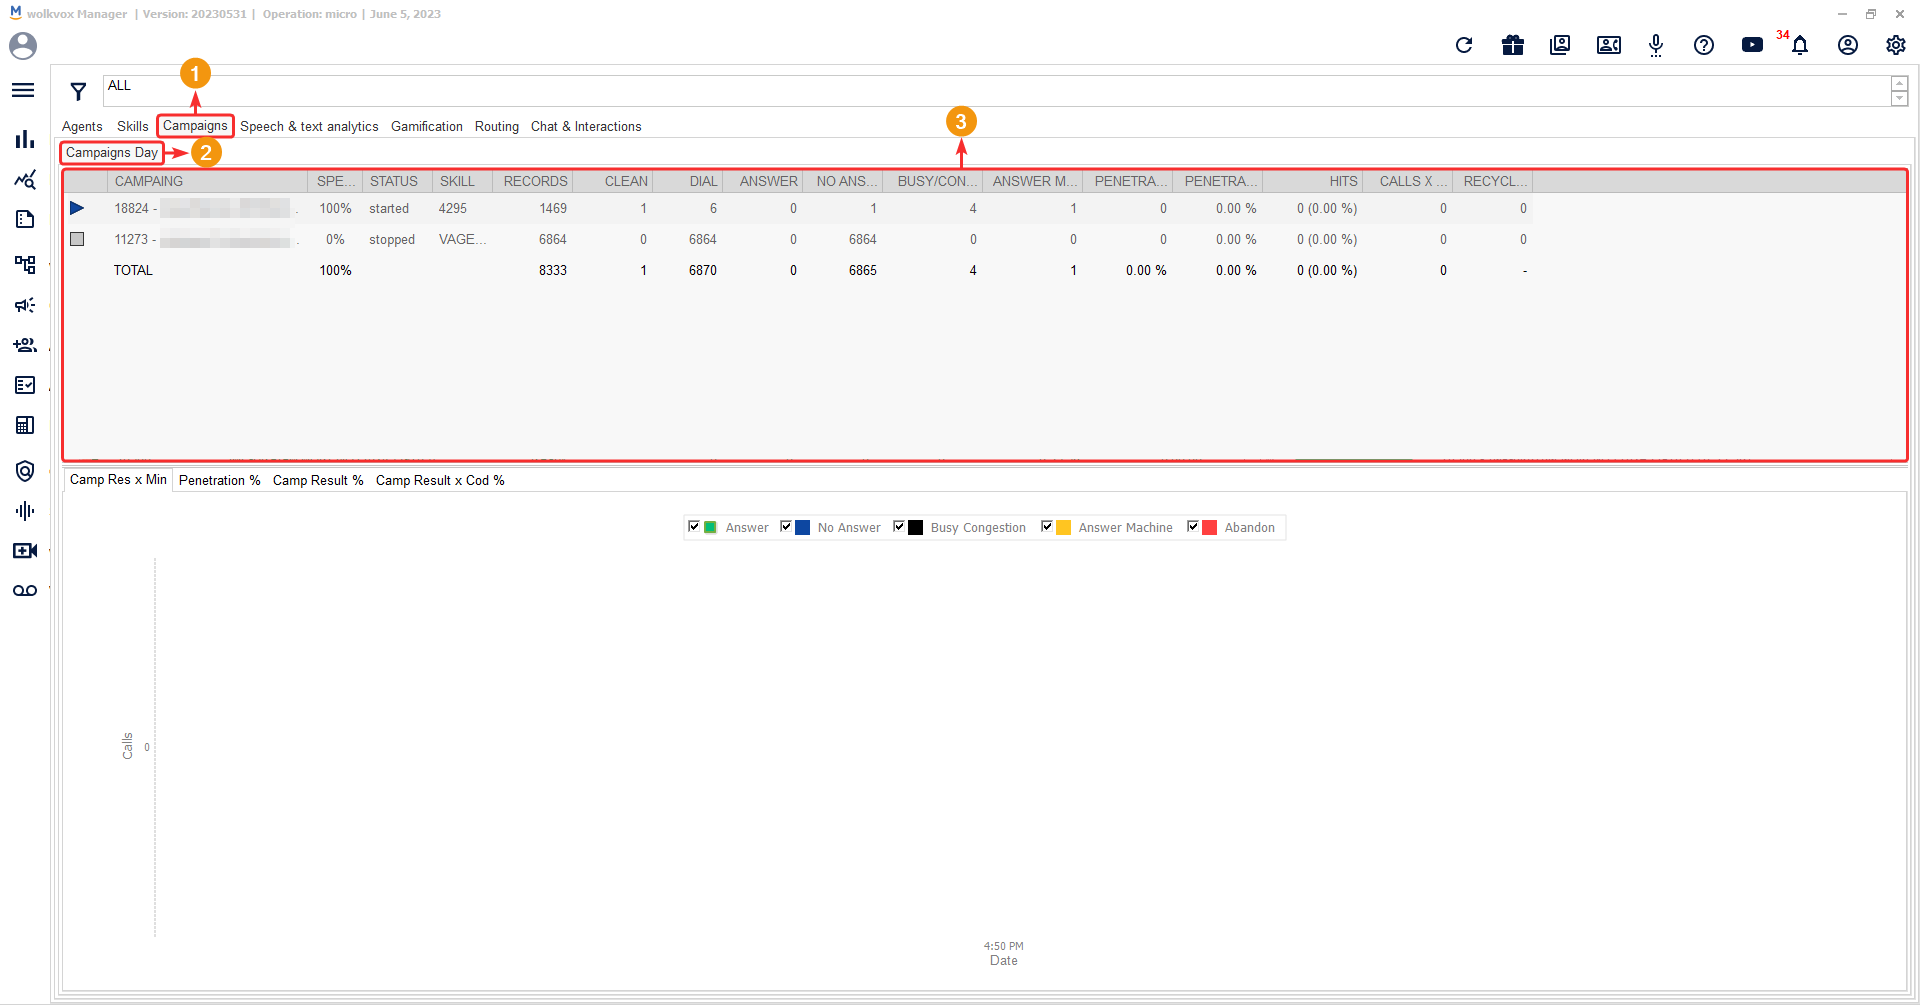
Campaign statistics #
In this tab, you can check the real-time status of the campaigns (if you have any active campaign and it is of the predictive/progressive type) through the listed fields, which correspond to speed, status, skill, recording, and other elements that make up the information in this module.
Below is an explanation of each of the columns seen in the report table:
- Campaign: Name of the campaign.
- Speed: The speed at which the campaign is being executed.
- Status: Current status of the campaign.
- Skill: Group of agents responsible for the campaign.
- Records: Number of records (clients) uploaded to the campaign.
- Clean: Number of total records (clients) that have not been contacted.
- Dial: Number of total records (clients) dialed.
- Answer: Number of answered calls.
- No answer: Number of unanswered calls.
- Busy/Congestion/Failed: Indicates the number of calls that could not be successful due to busy lines, congestion, or failures.
- Answer Machine: Number of calls answered by an answering machine.
- Penetration Day: Ability to achieve the business objective with the contacts that had communication during the day.
- Penetration Now: Ability to achieve the business objective with the contacts that had communication at the moment of real-time review.
- Hits: Number of calls that have ended successfully (taking into account the campaign’s objective).
- Calls x Min: Ratio of calls made per minute.
- Recycled: Calls that have been recycled.
Start, stop, or resume campaign #
There is the option to start, stop, or resume a campaign. To do this, right-click on the campaign, then select “Admin,” then “Start/Stop,” and finally click on “Stop” or “Start” depending on what you want and the current status of the campaign.

Change the campaign speed #
You can also change the speed at which the campaign is running. To do this, right-click on the campaign, then select “Speed,” and finally choose the percentage of speed at which you want the campaign to operate. This percentage ranges from 10% to 120%.
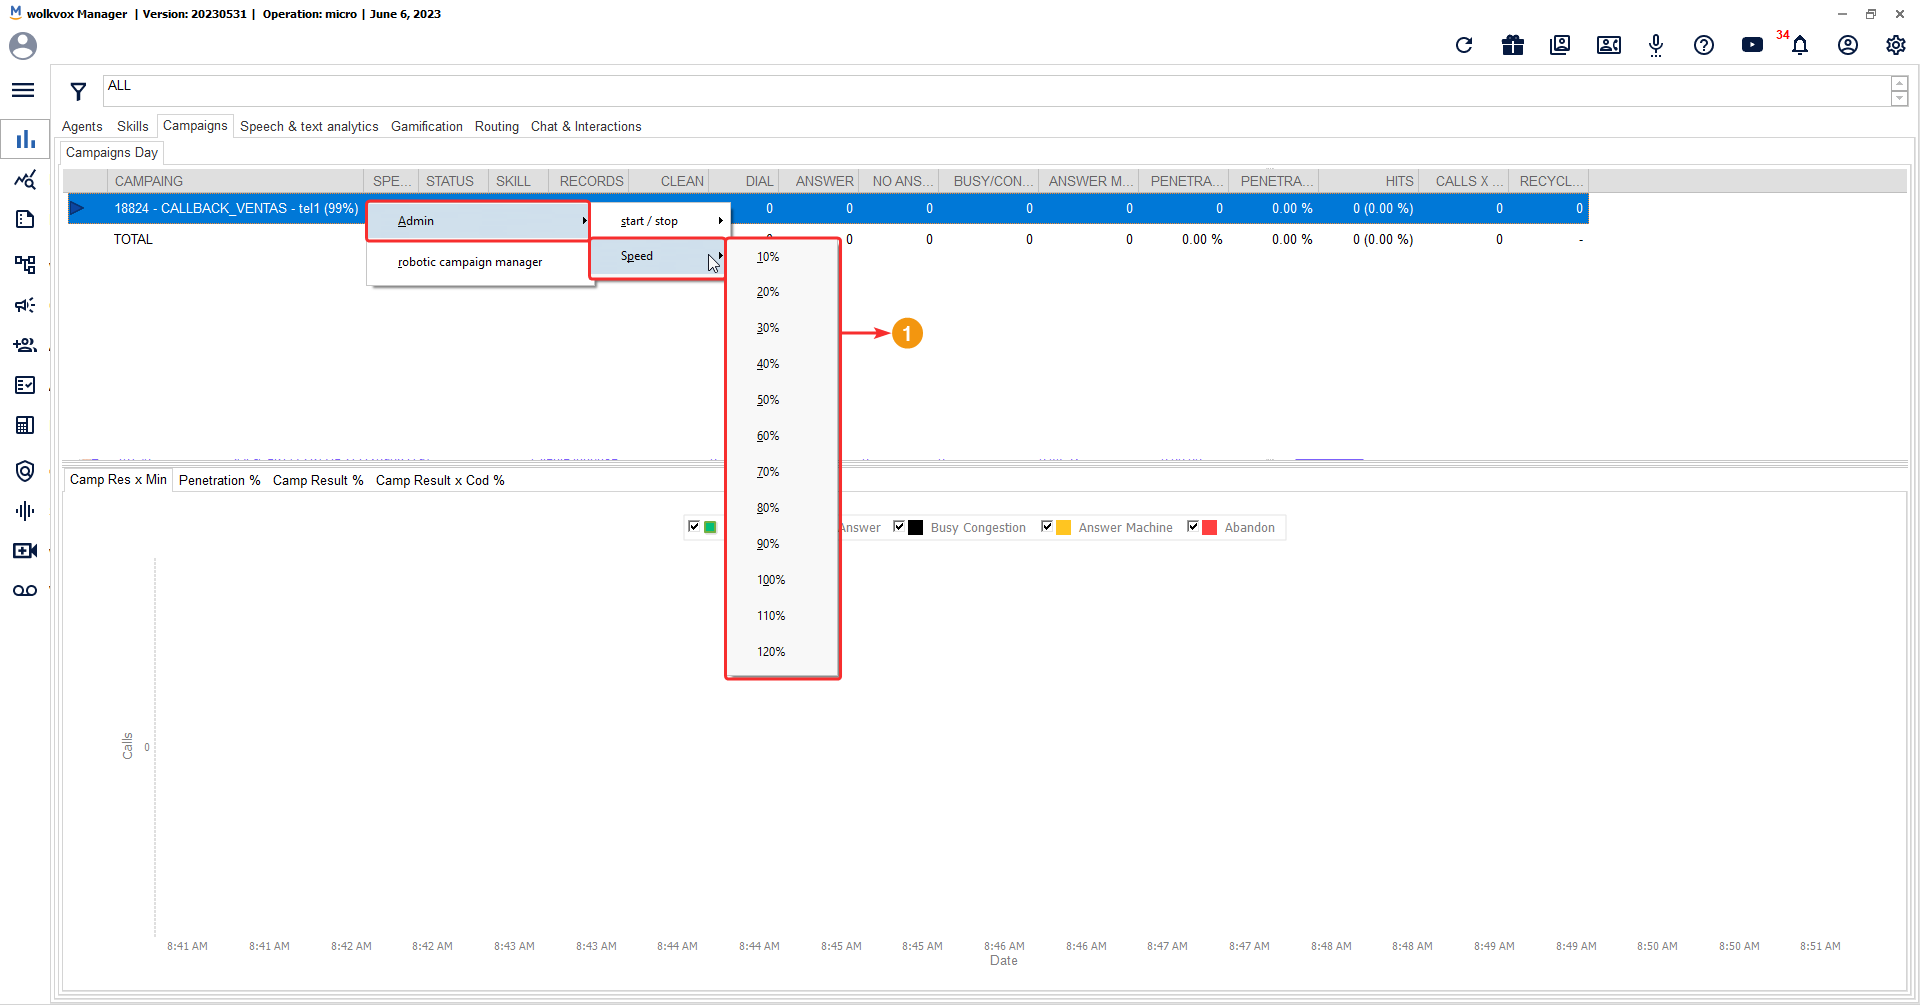
Campaign management robot service #
This service allows a robot to manage campaigns, such as starting or stopping the campaign and increasing or decreasing the speed, all depending on what the system analyzes, such as the number of connected agents, busy agents, results of each call, call schedules, among other aspects.
To activate the service, right-click on the campaign, then select “robotic campaign manager,” and finally, check the box labeled “Activate Robotic Campaign Manager.”

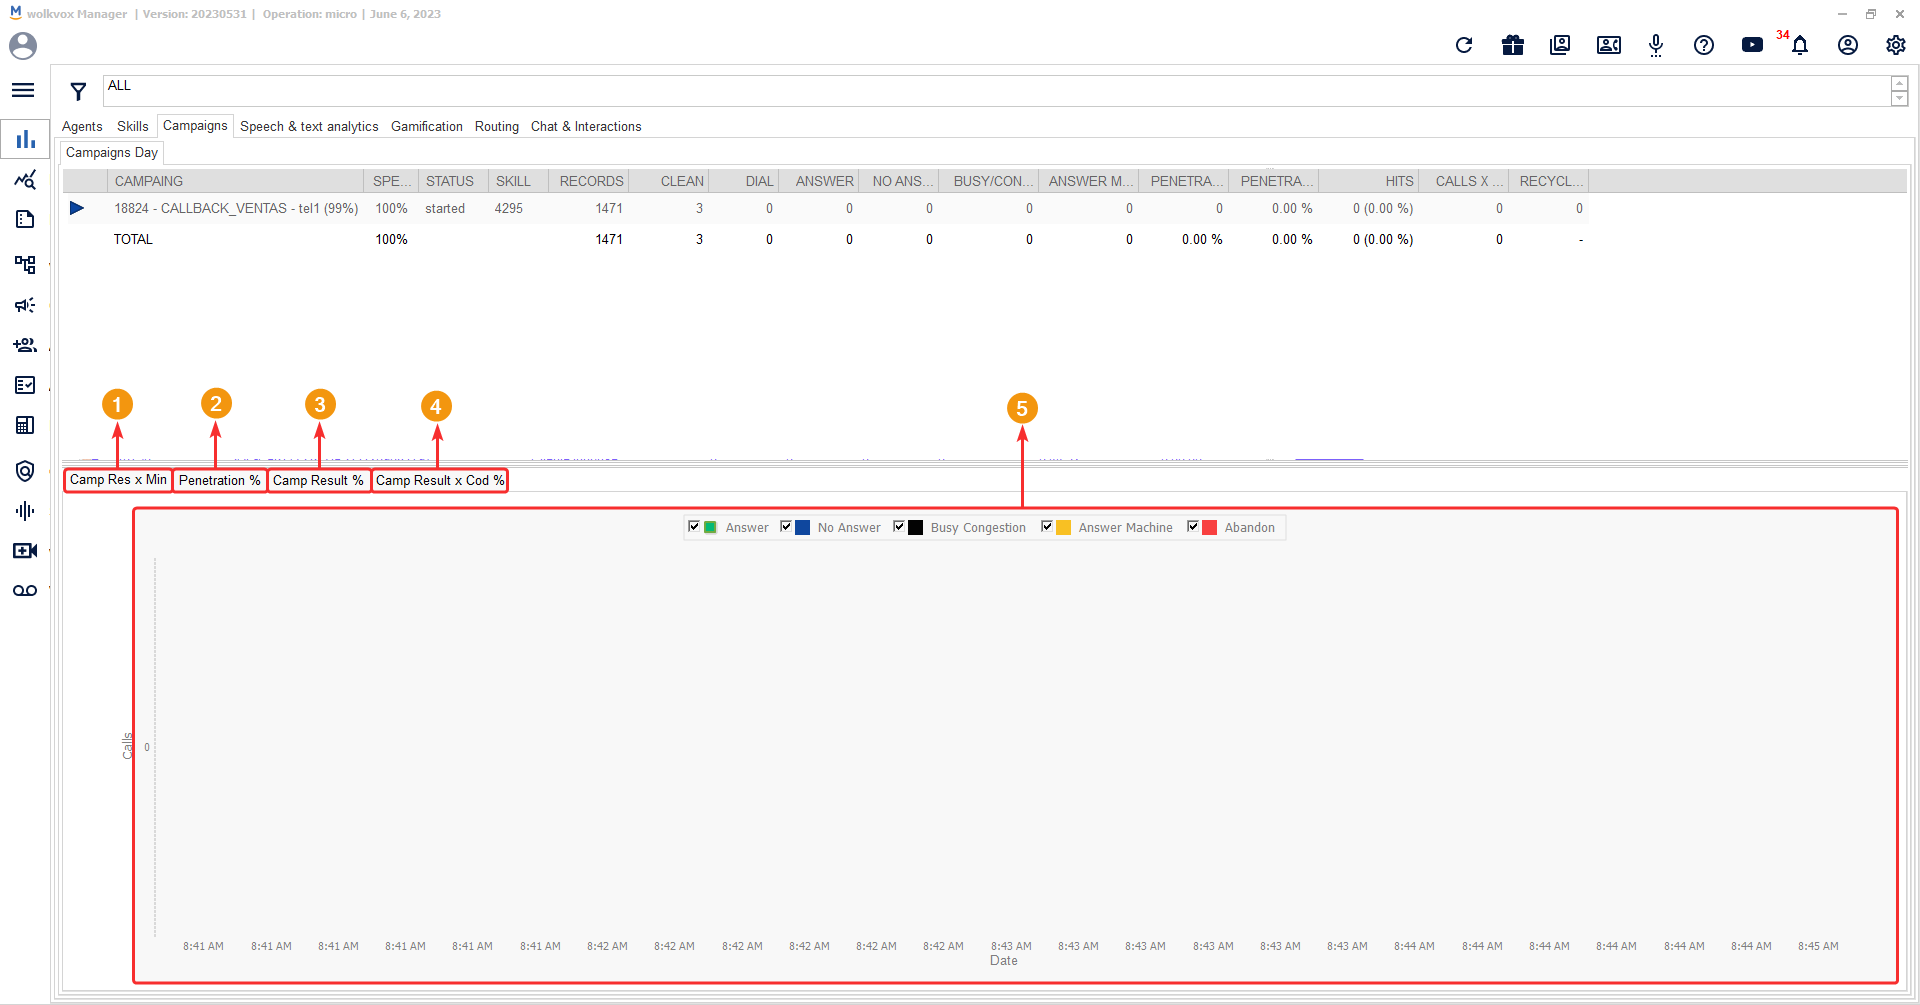
Statistical graphs of campaigns #
In the lower section of the “Campaigns” tab, you can see the following statistical graphs:
- Camp Res x Min: Here you can parameterize the graph to display individual statistics related to answered calls, unanswered calls, congestion, machine-answered calls, and abandoned calls. Activate the checkboxes for the statistics you need and deactivate the ones you don’t. You can also have all checkboxes activated.
- Penetration %: Displays the penetration percentage throughout the day for each minute.
- Camp Result %: This pie chart shows the percentage and quantity of answered calls, unanswered calls, congested calls, and machine-answered calls.
- Camp Result x Cod %: This graph displays the campaign results by activity codes or categorization.
Speech and Text Analytics #
This service allows you to monitor the speech and text analytics service, which means analyzing the conversations between agents and customers in voice and text channels. There are 3 tabs you can access: “Voice of the Customer,” “Quality Assurance,” and “Word Cloud.”
Note: It is possible to configure the reports in this section for various time periods. For example, you can filter to display the report for the last 24 hours, last 7 days, and last 30 days. The option to change the time period is located in the upper right corner of this section.
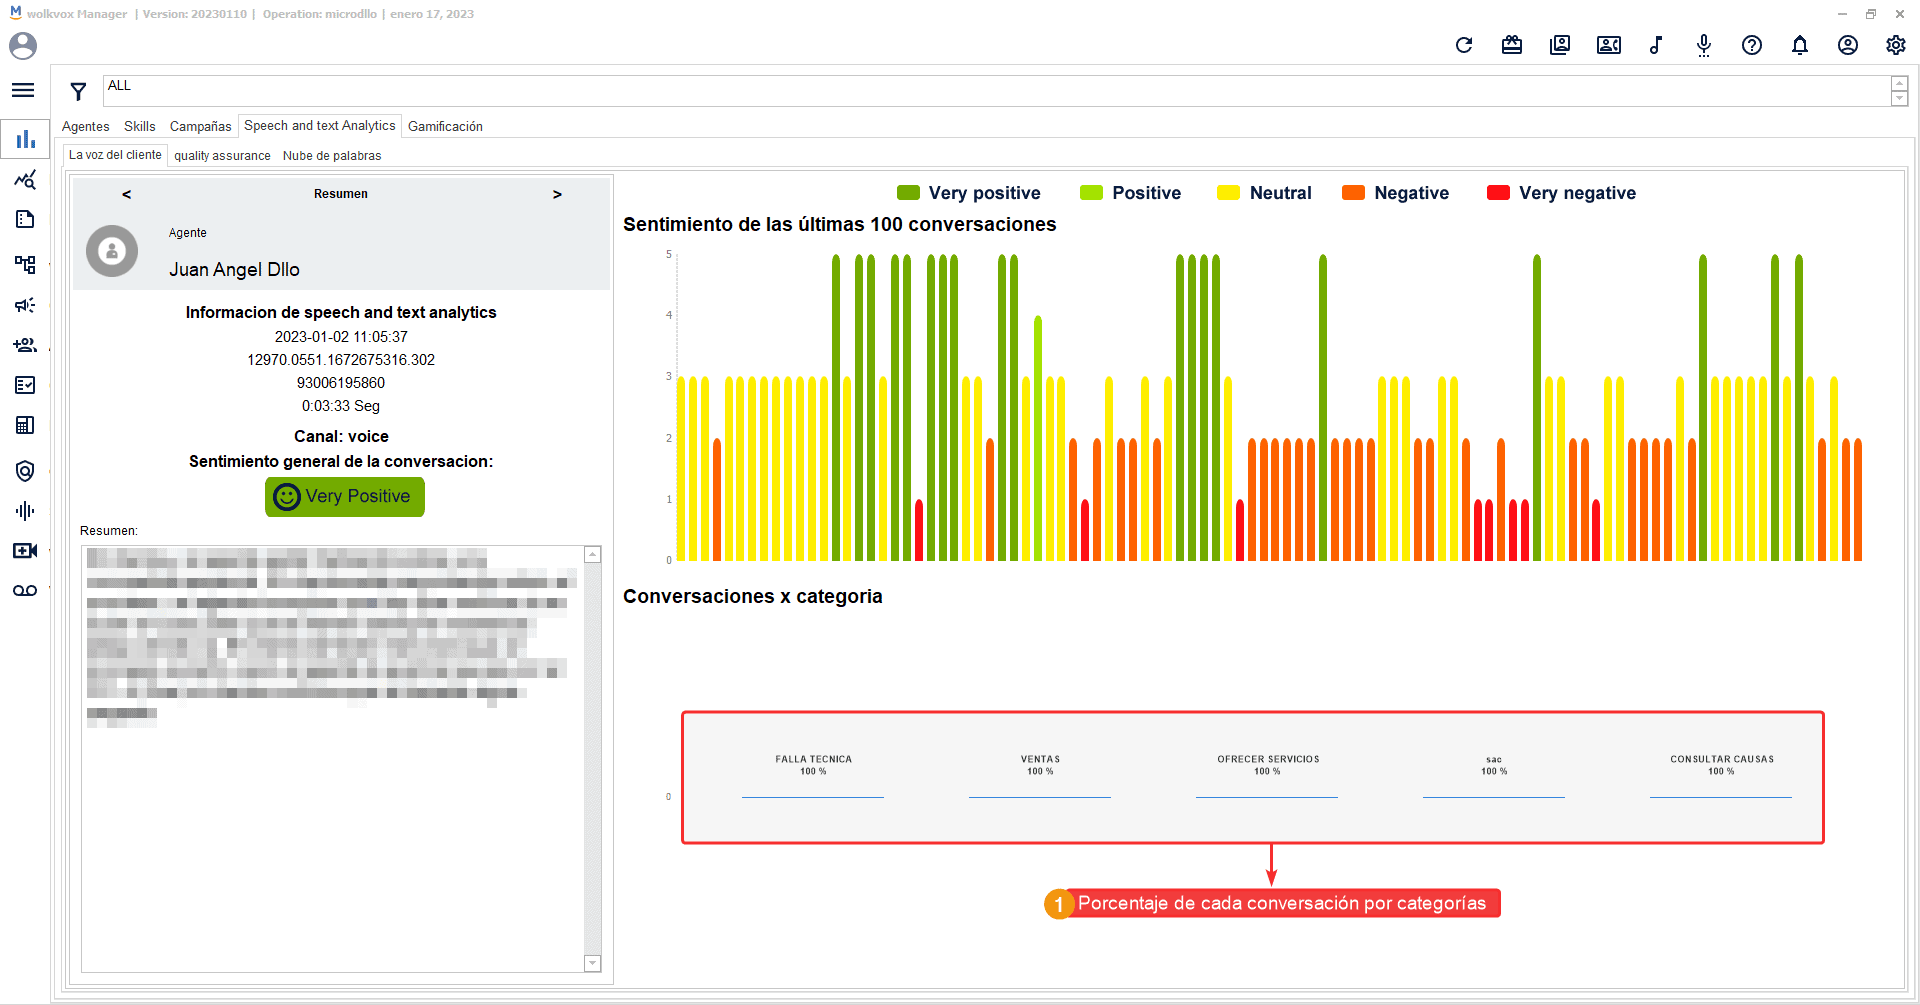
The Voice of the Customer #
In this tab, an analysis is made of the last 100 calls that went through the operation. You can notice that there is a division into 3 sections:
- On the left side, there is a summary of a conversation.
- On the right side and upper part, there is a bar chart with colored bars representing the sentiment identified in the conversation. It can be very negative, negative, neutral, positive, or very positive.
- On the right side and lower part, there is a chart that shows the calls depending on the category. It is important to clarify that the categories are created in the “Speech Analytics” section of the left side menu in Wolkvox Manager.

The first panel called “Summary” contains general information about some calls made by each agent. By using the arrows pointing left and right, navigation is allowed to find more call summaries. Each summary panel displays the following data:
- Agent’s name and extension number.
- Date and time of the contact.
- Call identification number.
- Phone number and call duration.
- Channel through which the contact was made.
- Sentiment identified in the call.
- Text summary of the conversation.

On the right panel, a graph is displayed regarding the sentiments identified in the last 100 calls. If you hover over each bar, its respective summary will be shown in the “Summary” section of the left sidebar.
The identified sentiments range from very negative to very positive, and each sentiment is distinguished by a different color.
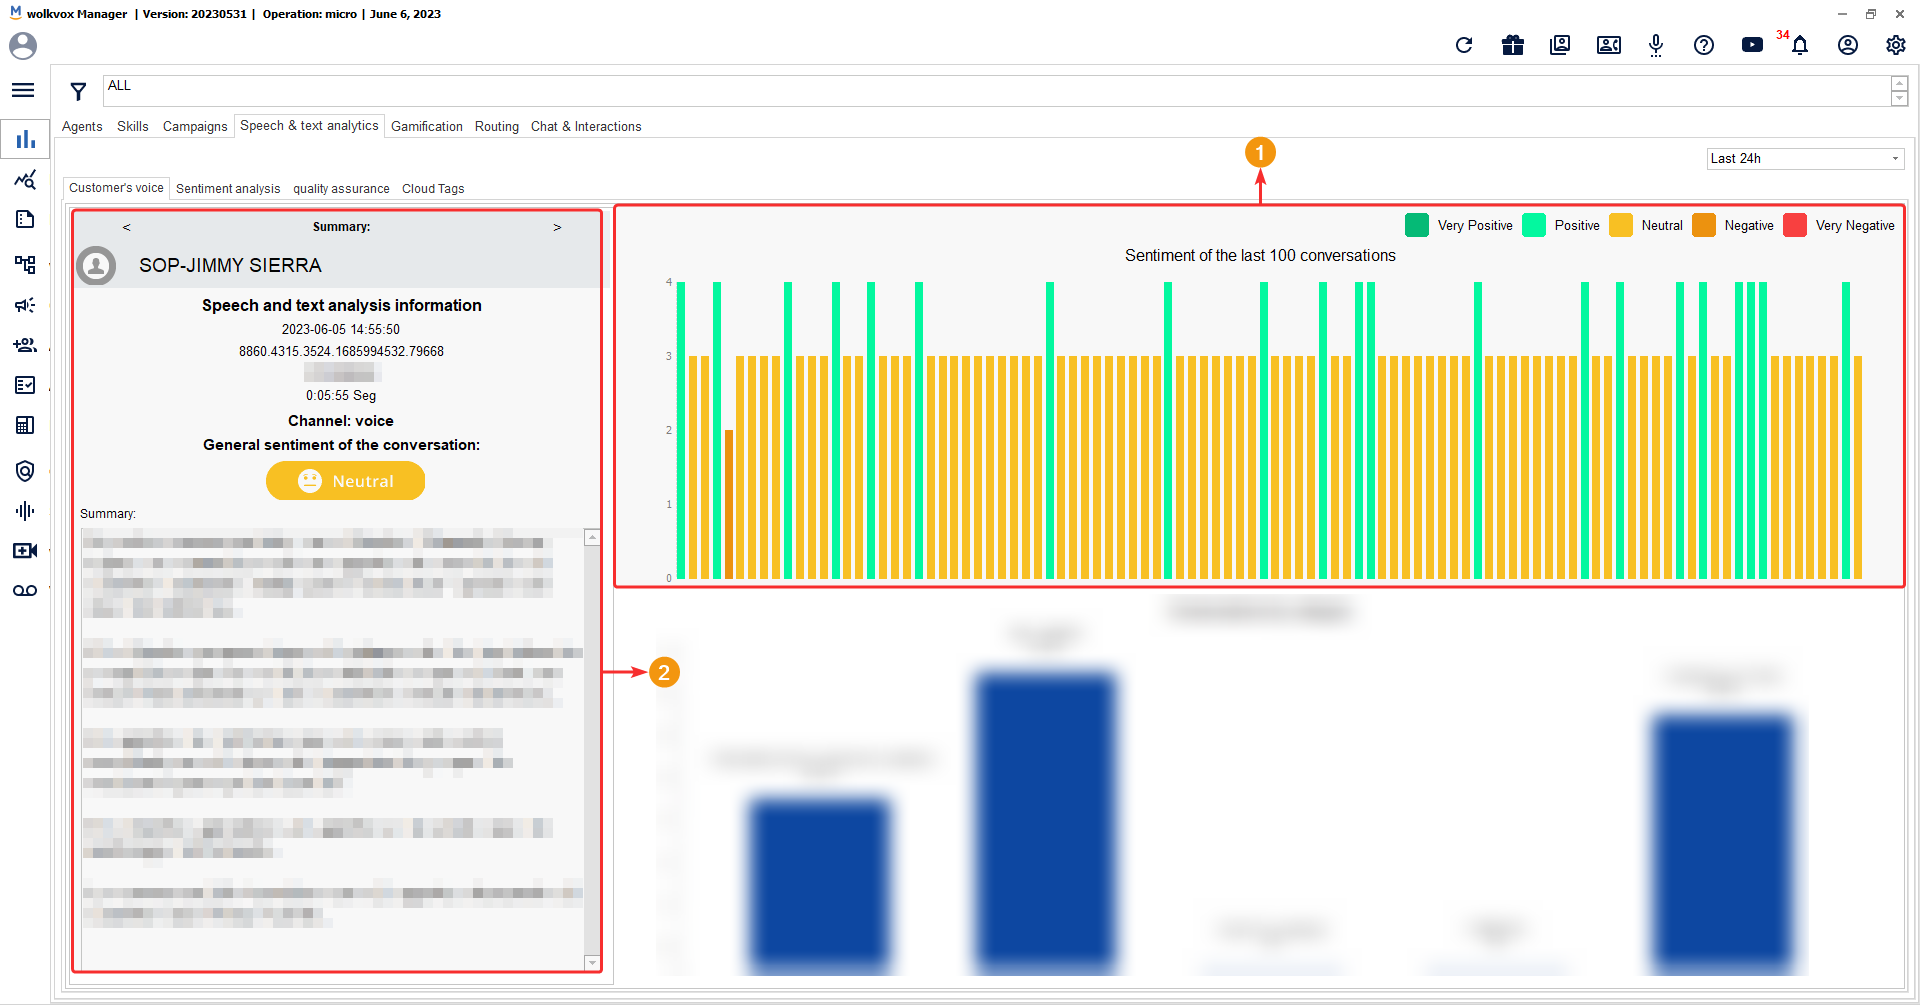
At the bottom, you can see the percentage of calls divided into categories. The system identifies the category based on specific words. The percentage of calls is shown for each category. Remember that each operation will have its own characteristics in this section, so your operation may not have the same categories as shown in the reference image. To create categories and set related words to help the system better identify calls, you need to go to the “Speech Analytics” section and navigate to “Configuration.”
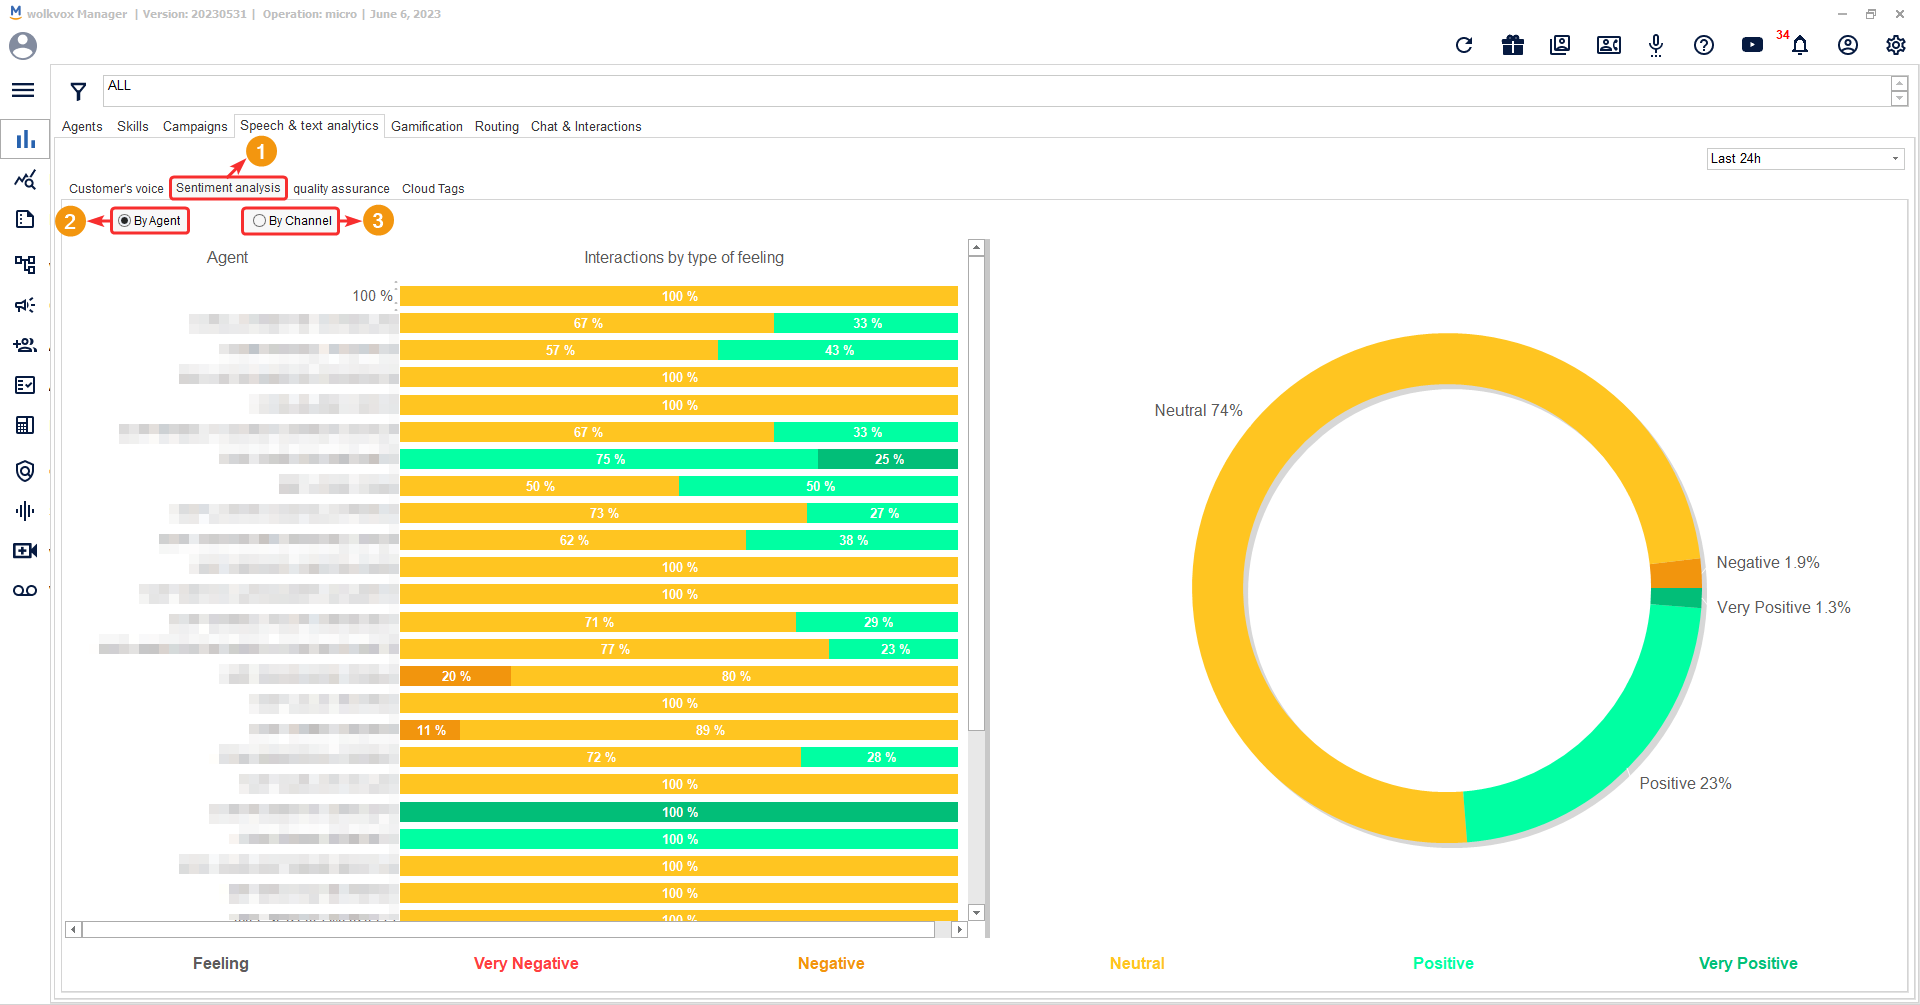
Sentiment analysis #
In this tab, the sentiment found in the interactions (voice and text) of the agents is analyzed. It is also possible to view the report filtered by channel type. In the filtered statistic “By Agent,” a bar chart is displayed on the left side, where you can see the statistics for each agent. In the filtered statistic “By Channel,” a bar chart is displayed on the left side, where you can see the statistics for each communication channel used. On the right side, there is always a pie chart that analyzes the sentiment in a general manner for the entire operation.
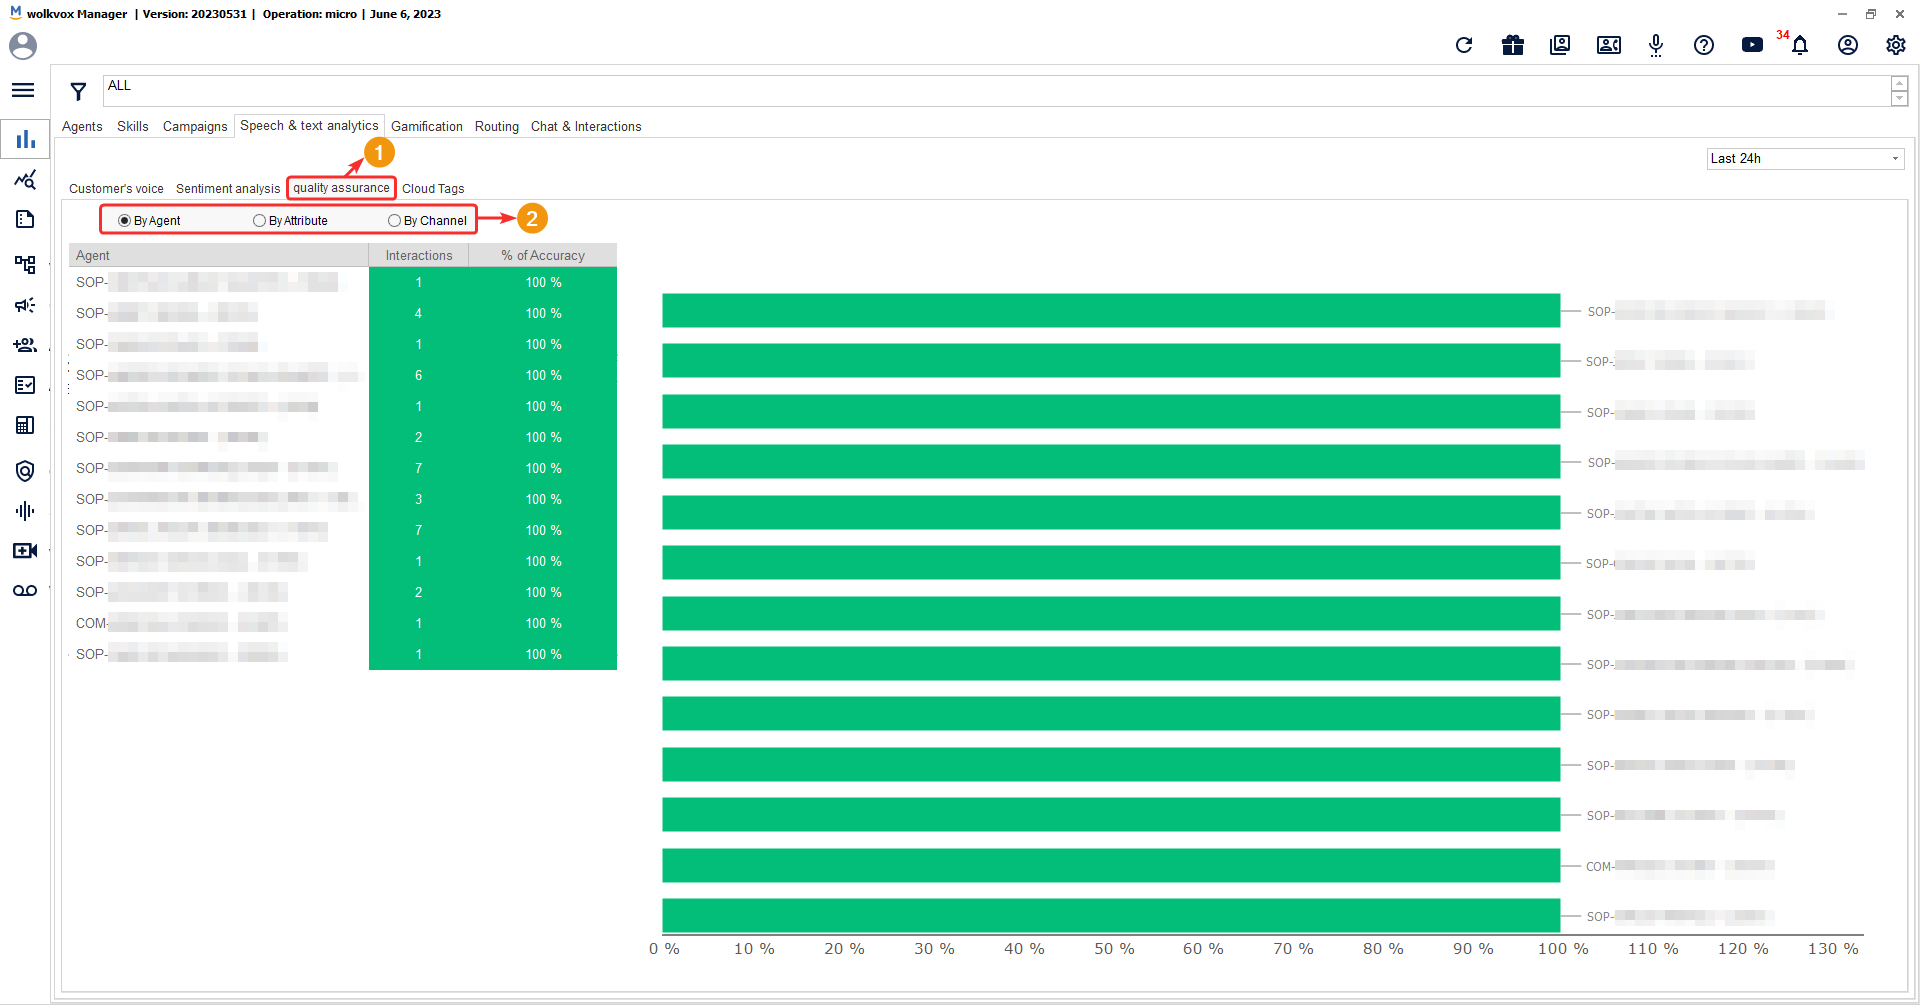
Quality Assurance #
In this tab, the percentage of quality assurance or quality guarantee is displayed. You can view statistics filtered by agent, attribute, or communication channel.
Cloud Tags #
The “Cloud Tags” section displays the topics discussed in the conversation. Thanks to this tool, there is a better understanding of the spoken content in the conversations. It clearly identifies the topics that were discussed.

Engaging in the gamification system with the agents #
In the “Gamification” tab, you will find a comprehensive and visually appealing section where you can view detailed information about each agent, important metrics, and a chat service where you can communicate with each agent. You can even create groups of agents and have group conversations via chat. This gamification system adds dynamism to the way you view agent statistics and their performance.

Agent information #
The first section that appears when opening the tab is “Agents”, at the top of this section you have a general statistical report of your operation. This report provides information about the total number of calls, HITs, AHT time, ACW time, and occupancy percentage. In this section, you can view the statistics of each of the agents.
This section organizes the list of agents according to the agent ranking. From top to bottom, it displays agents with the best statistics.
The statistics can be filtered to display data for the current day or month. For that purpose, you have the “Today” and “Month” tabs available.
Note: The statistics can be downloaded in Excel XLS format by clicking on the “Export” button for either the current day or the current month report.
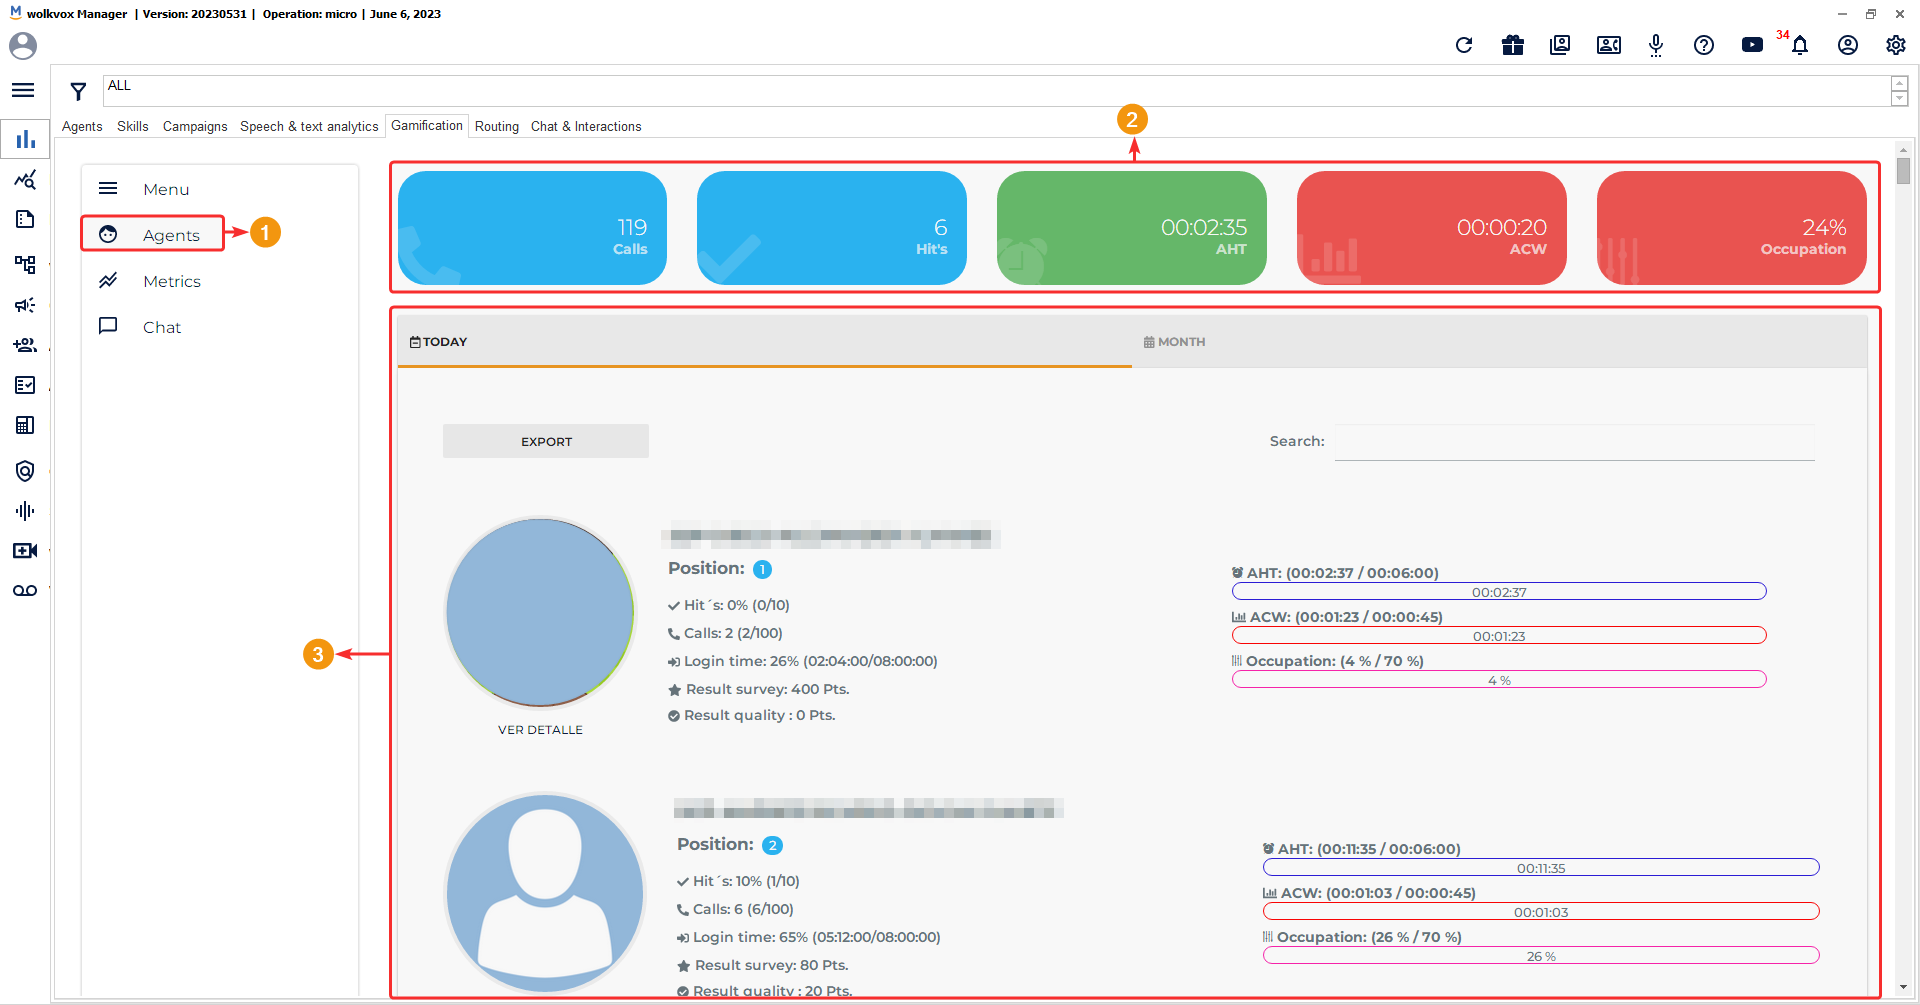
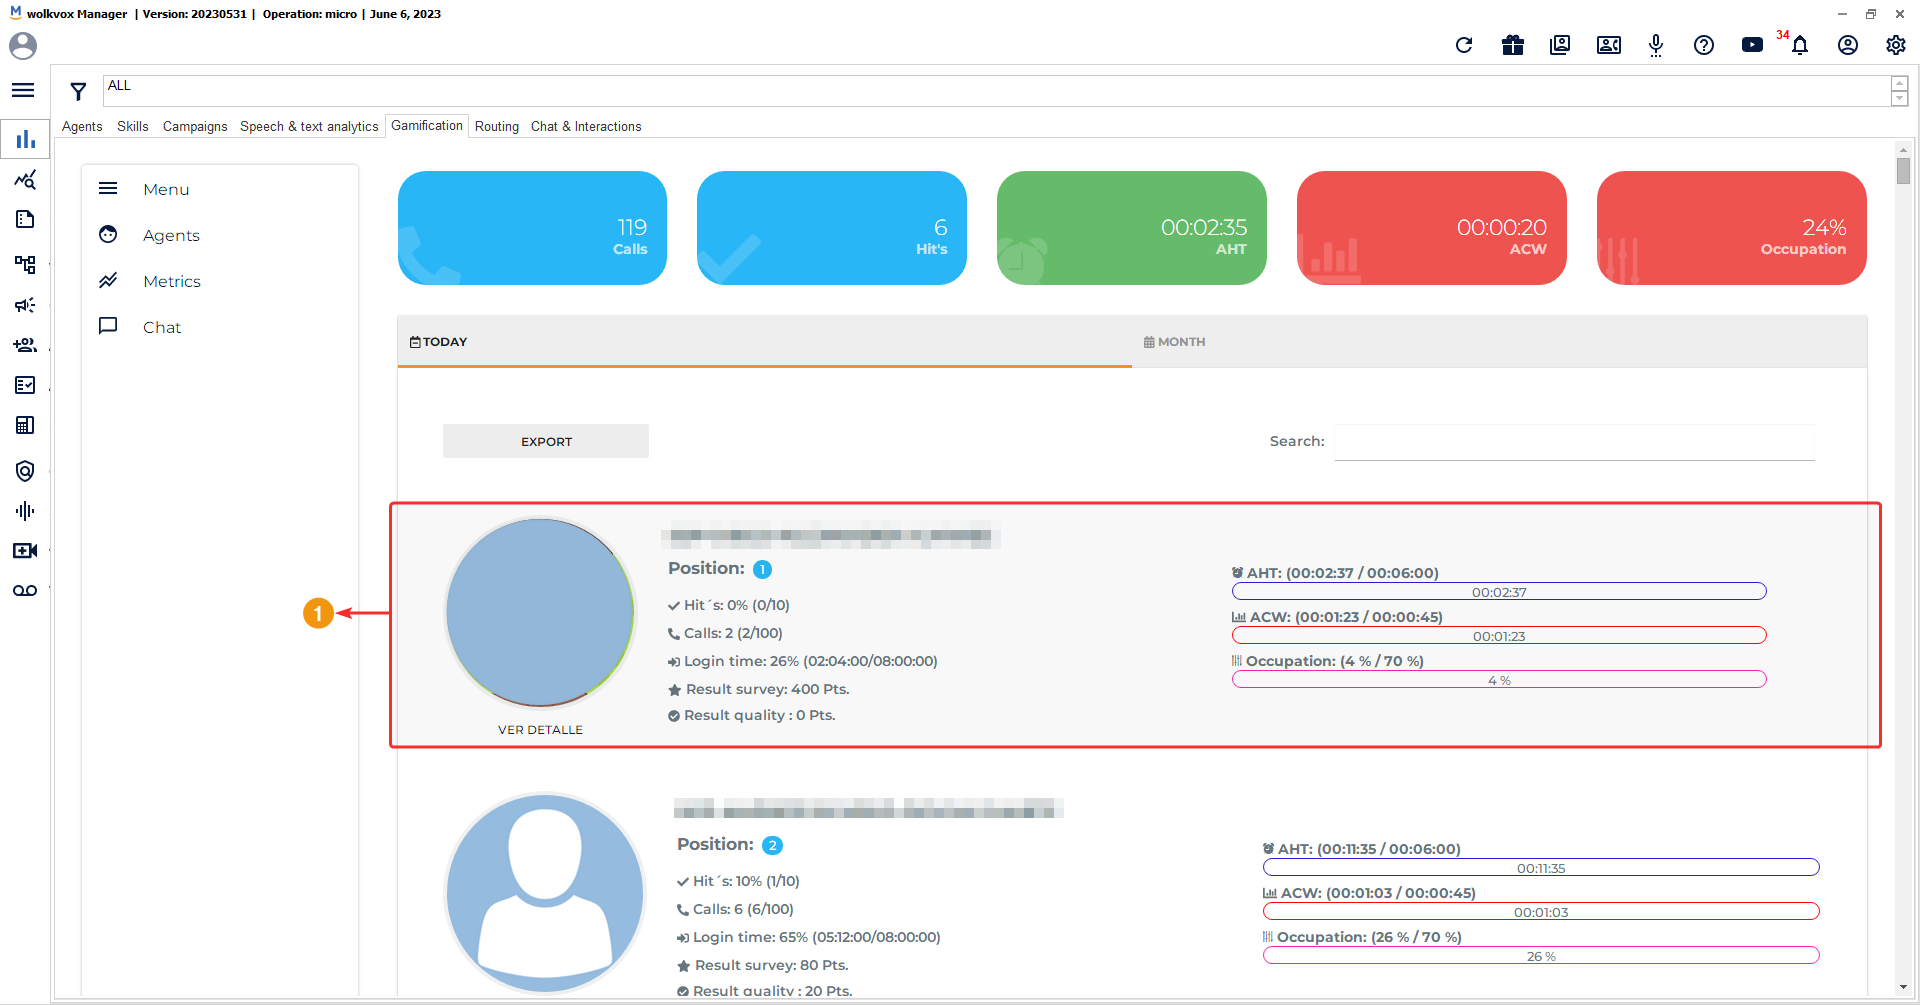
The information provided by the statistics of each agent is as follows:
- Agent Name.
- Position: Shows the agent’s ranking position in the overall agent list.
- Hits: Number of calls classified as “Hit” compared to the daily Hits target. Remember that a Hit is a call considered successful, based on call coding settings.
- Calls: Number of calls made by the agent compared to the daily call target set.
- Login time: Time the agent has been logged in compared to the total required login time for the day.
- Result survey: Score obtained from surveys.
- Result quality: Score obtained from quality analysis.
- AHT: Time spent in AHT (Average Handle Time) compared to the daily maximum set as a target. Remember that AHT measures the time the agent has spent in conversation, plus time in ACW or call coding, and time when the agent puts the customer on hold.
- ACW: Time spent in ACW (After Call Work) compared to the maximum per customer set as a target. Remember that ACW measures the time the agent has spent on call coding.
- Occupancy: Average current occupancy percentage compared to the minimum set as a target.
Note: By clicking on the “View Details” button, which is present for each agent, you can view in detail and graphically visualize these important data for each agent.
Individual indicators per agent #
By clicking on “View Details” for each agent, all detailed charts about the selected agent are displayed. The available indicators are:
- History of Hits: Shows the number of calls categorized as Hits in the last 30 days. Remember that Hits represent successful calls, and this attribute is assigned in the coding configuration.
- Call History: Displays the number of calls made in the last 30 days.
- AHT: Shows the average operation time (in seconds) of the agent in the last 30 days. This time includes the agent’s time on the call, waiting with the customer, and coding each call.
- ACW: Displays the average time (in seconds) spent by the agent in call coding in the last 30 days.
- Occupation: Shows the agent’s occupation percentage in the last 30 days. This time includes the agent’s time in the “talk” state, meaning when the agent is on a call with the customer, plus the time in the “ACW” state.
- Login Time: Displays the agent’s connection time in the last 30 days.
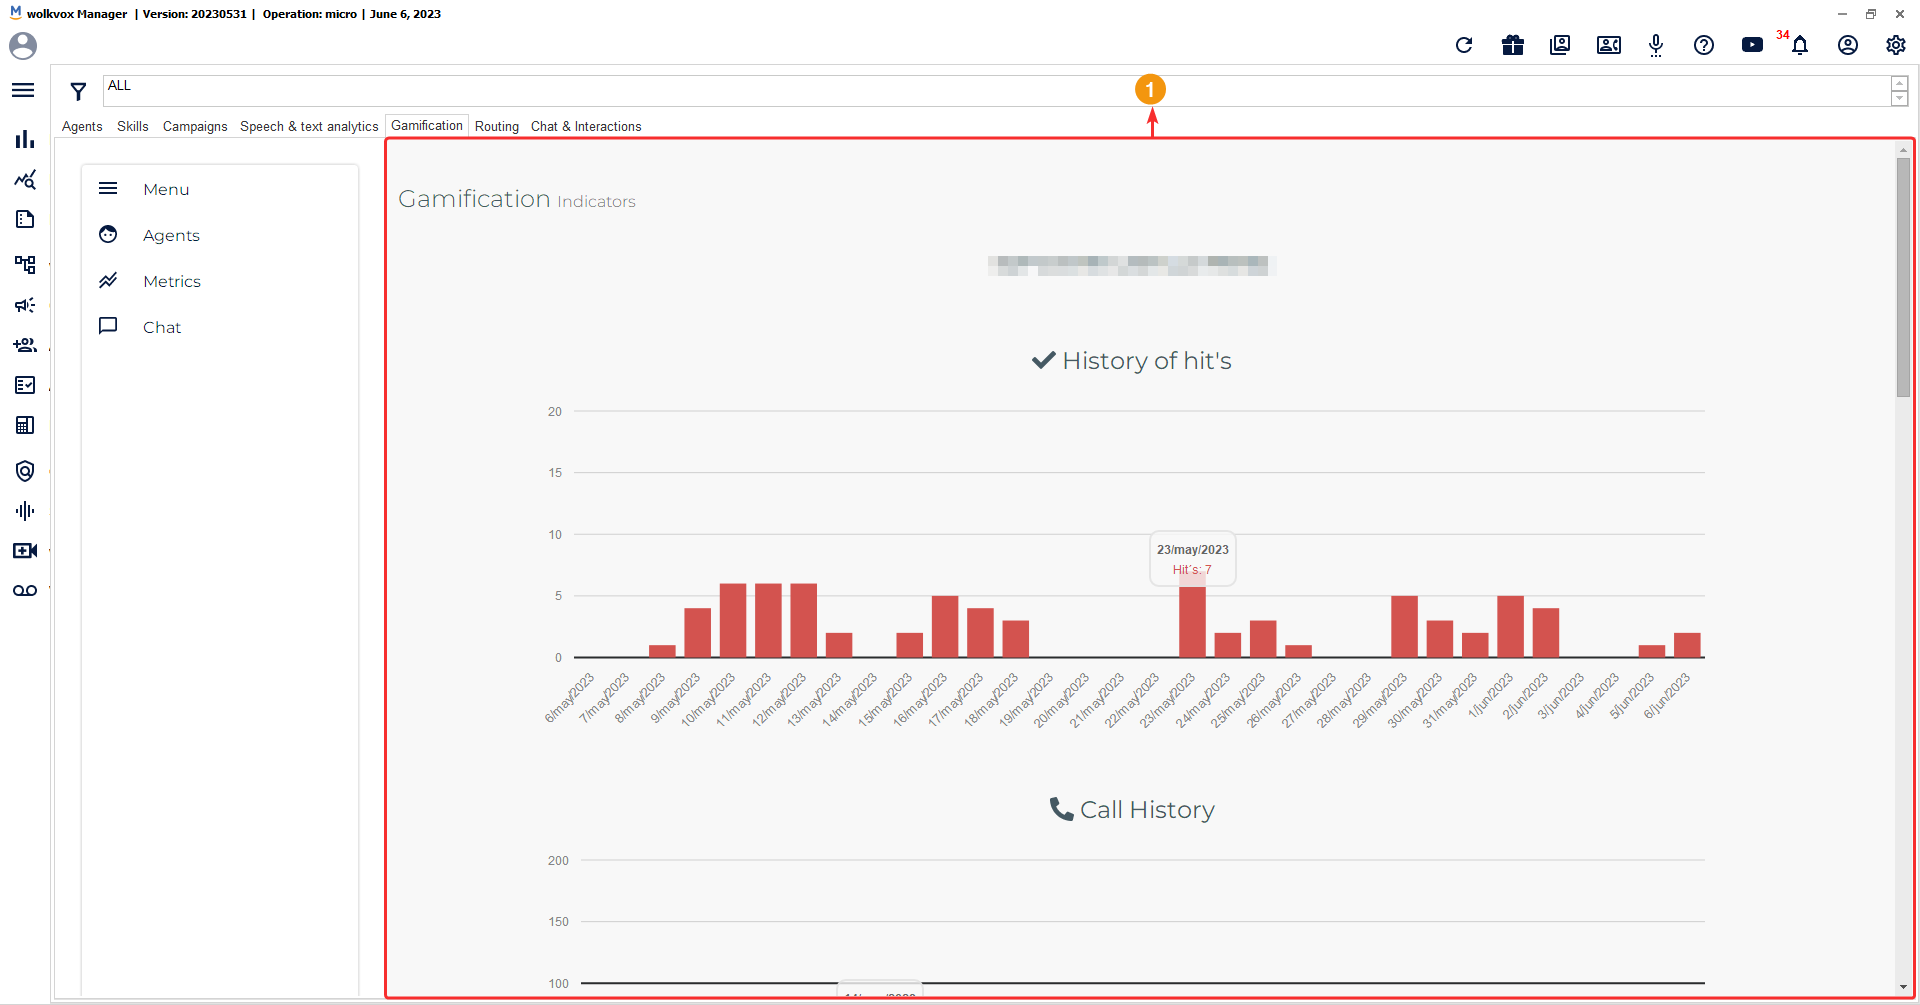
Overall operation indicators #
In the “Indicators” button of the left sidebar menu, you can access the general operation indicators. These indicators provide the following information:
- History of Hits: Shows the number of calls categorized as Hits in the last 30 days.
- Call History: Displays the number of calls made in the last 30 days.
- AHT: Shows the average call handling time (in seconds) in the last 30 days.
- ACW: Displays the average call coding time (in seconds) in the last 30 days.
Chatting with one or multiple agents #
The gamification service includes an internal communication tool called “Chat.” This tool allows you to initiate a text conversation with one or multiple agents in your operation.
Follow the steps below:
- Click on the “New Chat” button.
- Select the agent(s) you want to chat with. If you need more than one agent, you can select them one by one.
- Click on “Start Chat”.
If you select multiple agents, the system will ask you to assign a name to the chat group. However, if you create a chat with just one agent, the chat name will be the agent’s extension number along with their respective name.
Each chat has its respective options. To configure the options of a chat, follow these steps.
- Click on the arrow next to the chat.
- Edit the chat name.
- Add or remove members from the chat.
- Delete the chat.
When selecting a chat, the conversation opens in the central part. You have a field available to write the message you want to send and a button to send the message. Each message in the conversation displays the name of the sender, as well as the date and time it was sent.
Real-time statistics about Routing Points #
In the “Routing” tab, you can check real-time statistical information about the Routing Points you have created. Each column in the report table displays:
- Routing Point: Routing Point number.
- Name: Routing Point name.
- IVR Calls: Number of calls that have passed through the IVR.
- IVR Duration: Duration (in minutes) of the total calls that have passed through the IVR.
- Emails: Number of emails that have been sent.
- Facebook Page: Number of interactions that have occurred on Facebook Page.
- Twitter: Number of interactions that have occurred on Twitter.
- Bot Facebook: Number of times the Facebook Bot has been used.
- Bot WhatsApp: Number of times the WhatsApp Bot has been used.
- Bot Web Chat: Number of times the Web Chat Bot has been used.
- Bot Line: Number of times the Line Bot has been used.
- Bot Telegram: Number of times the Telegram Bot has been used.

Real-time statistics of chats and interactions #
In the “Chat & Interactions” tab, you can see the number of chats and interactions that agents have had throughout the day, along with important information about them. You can even preview the chats and interactions to verify the agents’ behavior in communication with customers.
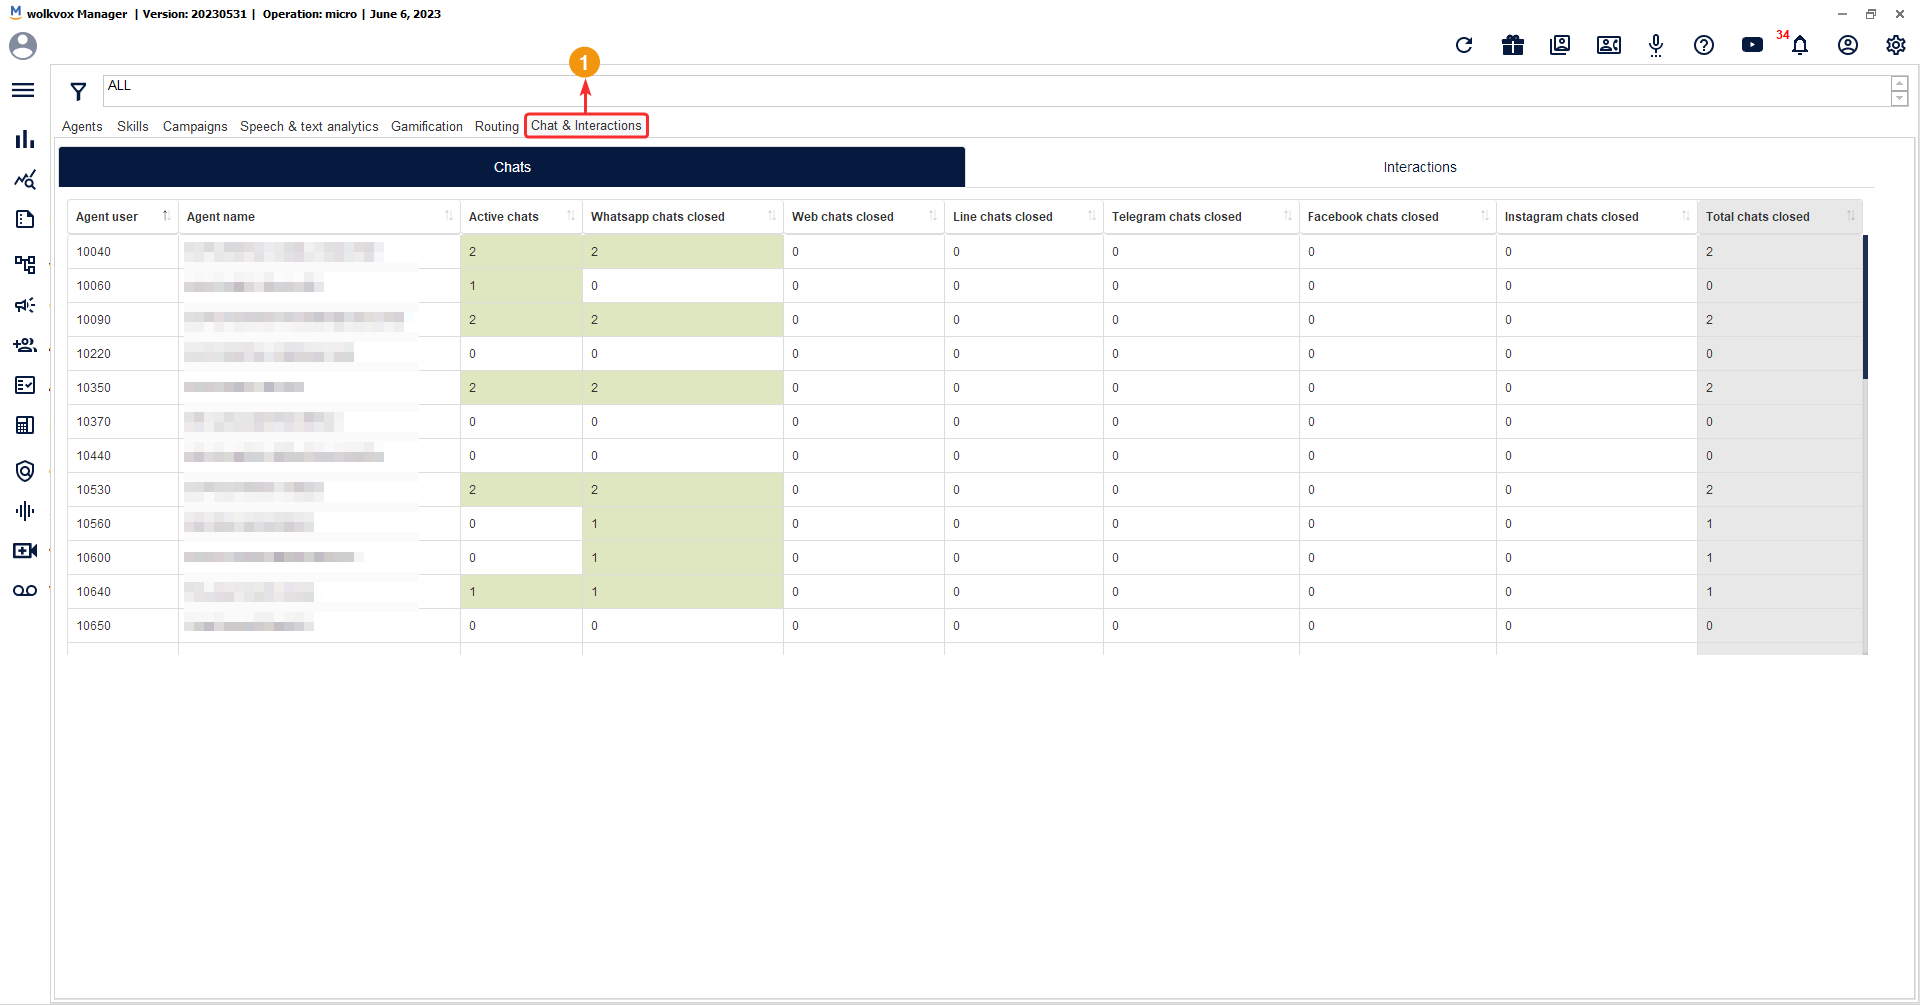
Chats #
In the “Chats” section, you can see a table that contains the statistics for each agent regarding this type of conversation. In the columns, you can find the following information:
- Agent User: Agent’s extension number.
- Agent Name: Agent’s name.
- Active chats: Number of initiated and active chats.
- WhatsApp chats closed: Number of closed chats on WhatsApp.
- Web chats closed: Number of closed chats on the web chat integrated with wolkvox Manager.
- Line chats closed: Number of closed chats on Line.
- Telegram chats closed: Number of closed chats on Telegram.
- Facebook chats closed: Number of closed chats on Messenger.
- Instagram chats closed: Number of closed chats on Instagram.
- Total chats closed: Total number of closed chats, combining all the mentioned platforms.

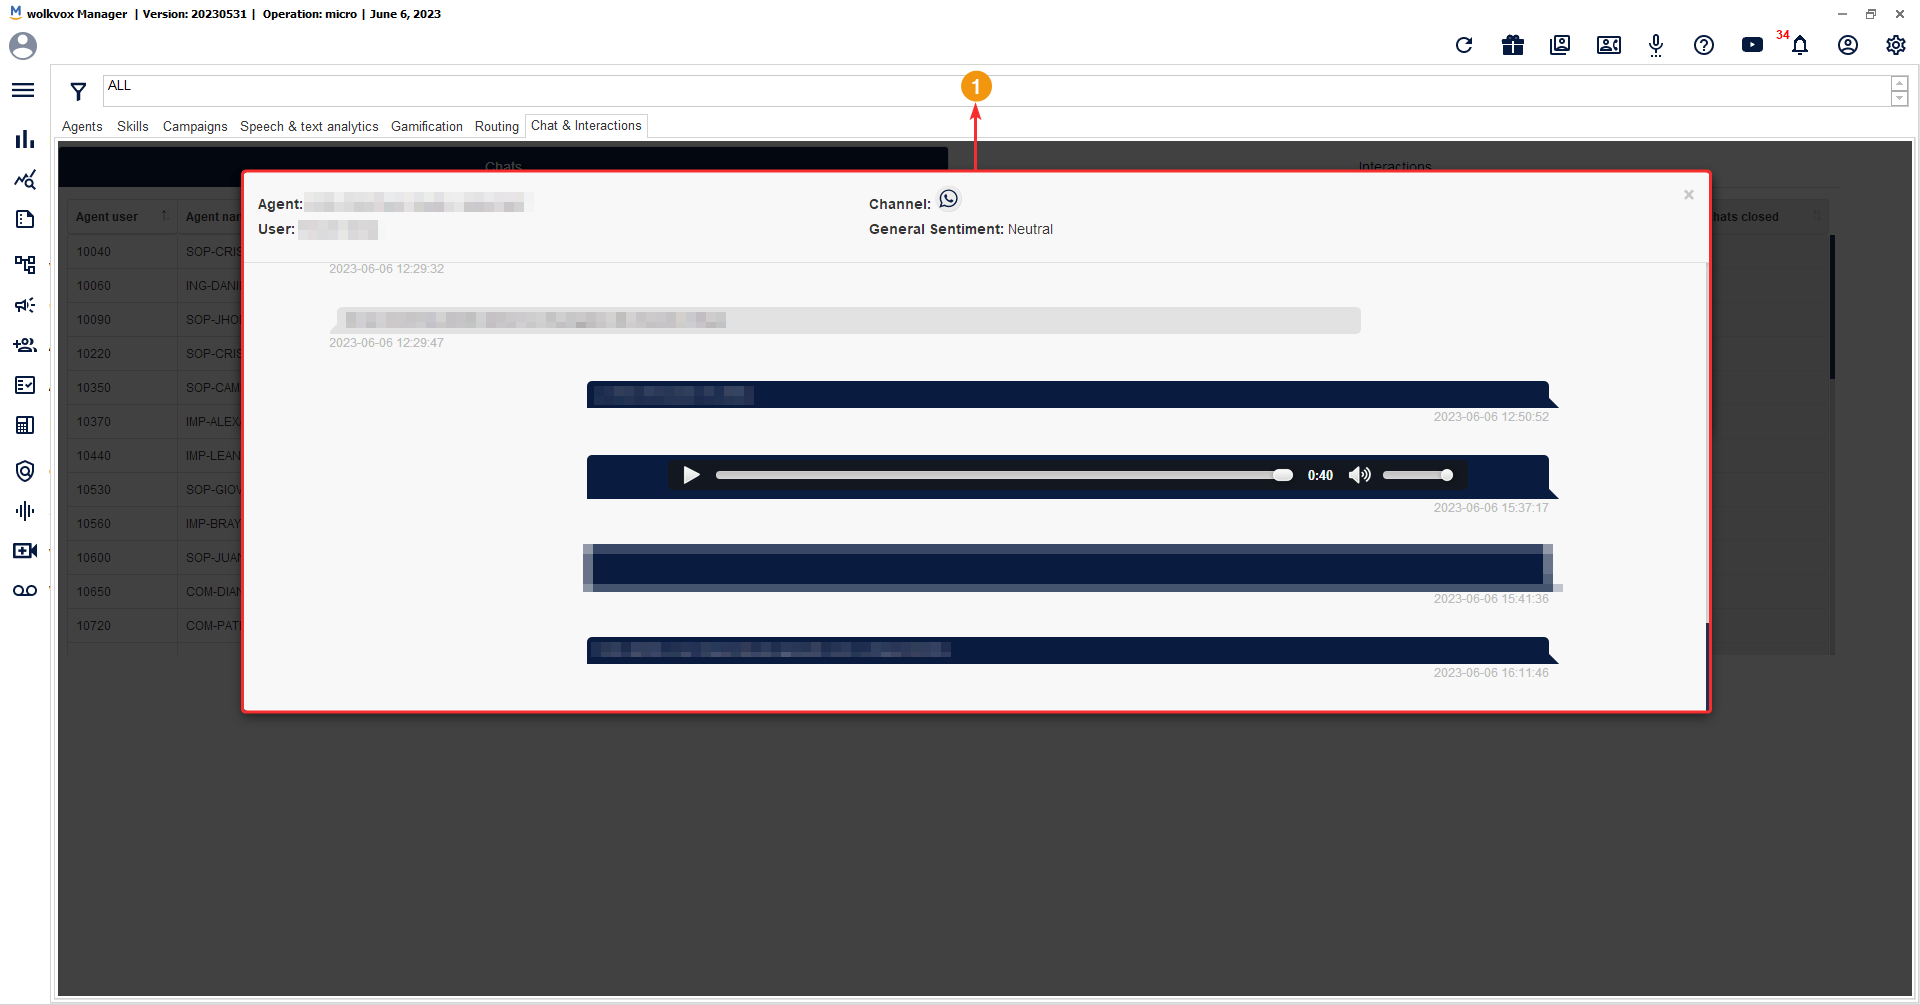
By clicking on one of the elements in the “Active Chats” column, a window opens where you can view basic information about each active chat of the agent. This is useful for verifying how the customer is being assisted in the conversation. The preview window of active chats displays the icon of the communication channel, the chat or client’s name, the duration of the conversation, and the sentiment of the chat participants.

When you click on one of the active chats, a window will open where you can view the complete conversation history between the agent and the customer. You can clearly identify the referenced agent and customer, the overall sentiment of the conversation, the type of chat channel, and the date and time the messages were sent. You will be able to view text messages and listen to audio recordings.
Interactions #
In the “Interactions” section, you can see a table that contains statistics for each agent regarding different interaction channels such as email, Facebook Pages, Instagram, and Twitter.
The columns display the following information:
- Agent ID: Agent’s extension number.
- Name: Agent’s name.
- Email: Number of interactions via email.
- Facebook Page: Number of interactions via Facebook.
- Instagram: Number of interactions via Instagram.
- Twitter: Number of interactions via Twitter.
- Universal: Number of interactions via the universal channel.
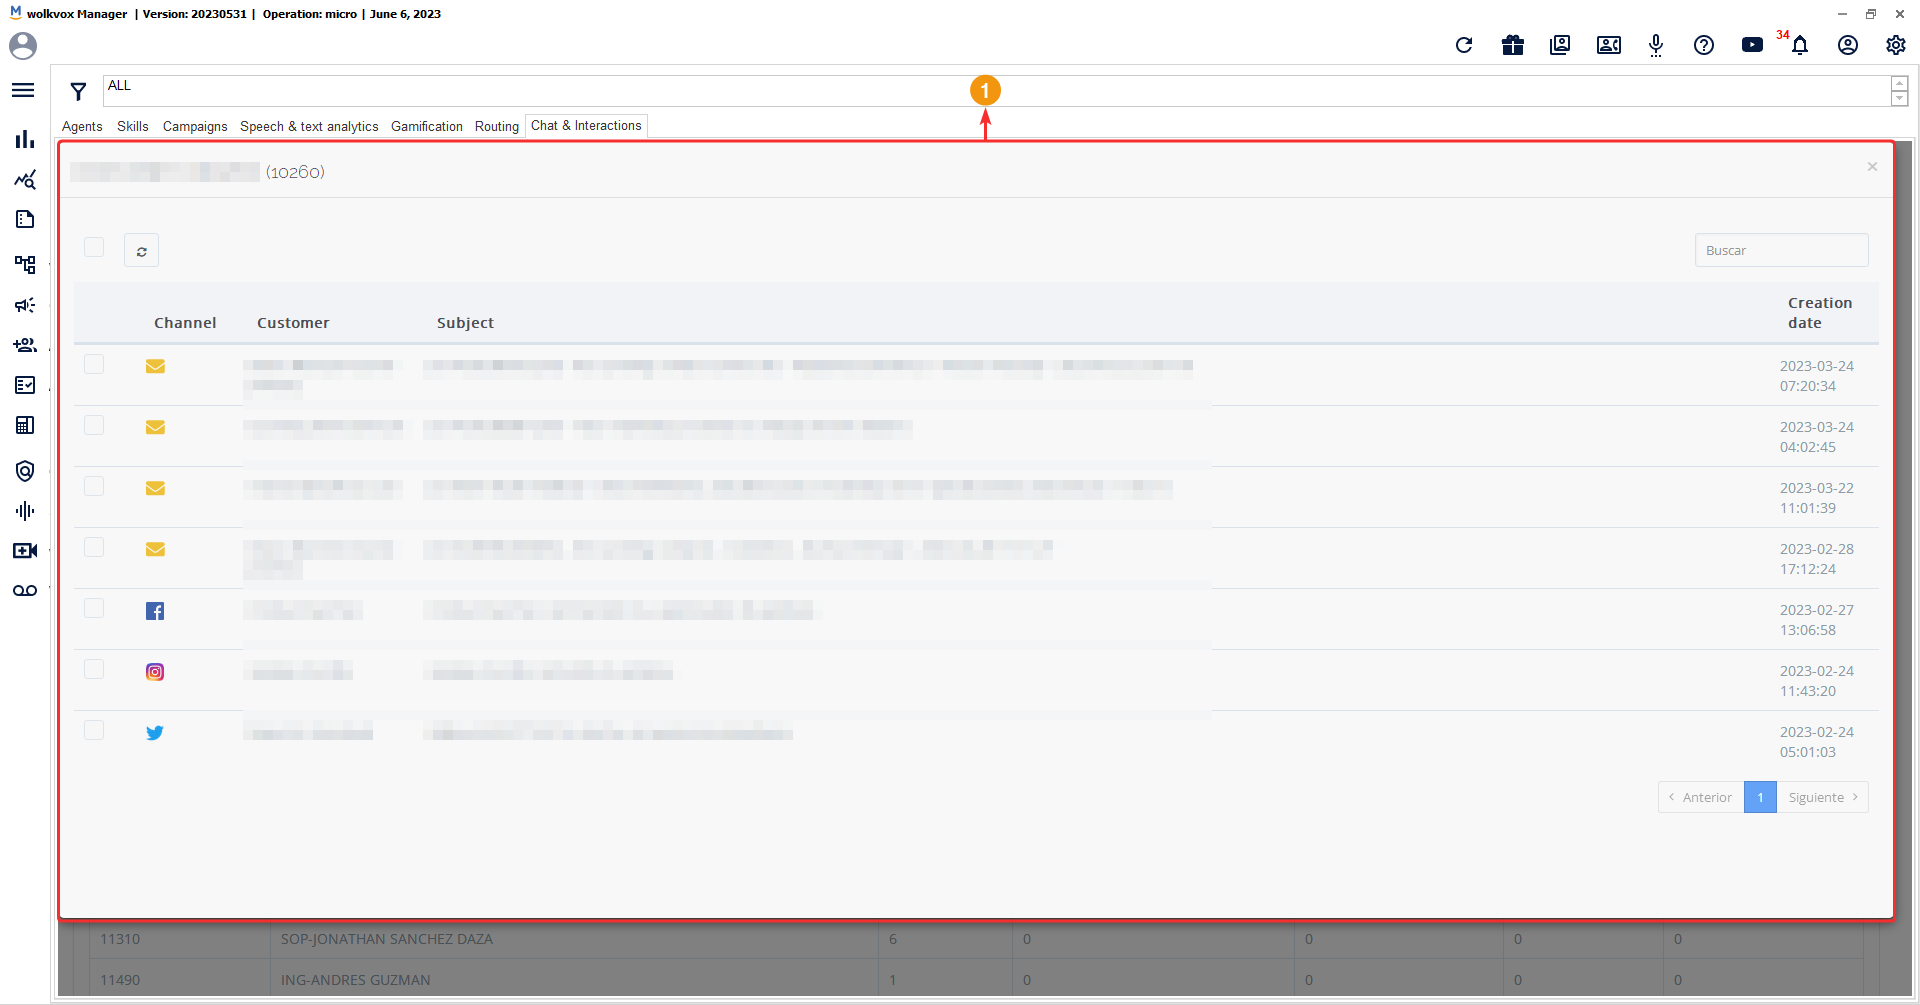
![]() You can click on an agent from the list to view the details of their interactions.
You can click on an agent from the list to view the details of their interactions.

When you click on an agent from the list, you can see all of their interactions, and if you enter each interaction, you can have a preview of each one. In the icon of the “Channel” column, you can verify which type of channel each interaction refers to. Remember that this section lists interactions in posts from various integrated social media platforms and emails. Chats are not listed in this section.
![]() Click on any interaction to preview the entire history.
Click on any interaction to preview the entire history.
Transfer one or multiple interactions to an agent or skill #
It is possible to transfer one or more interactions to an agent or skill. You can even select multiple interactions from different types of interaction channels to send them to another agent or group of agents (skill).
First, you need to select (using the checkboxes on the left side) the interactions you want to transfer. Then, choose whether you want to transfer to an agent or skill, and finally, select the desired agent or skill and click on “Transfer”.

